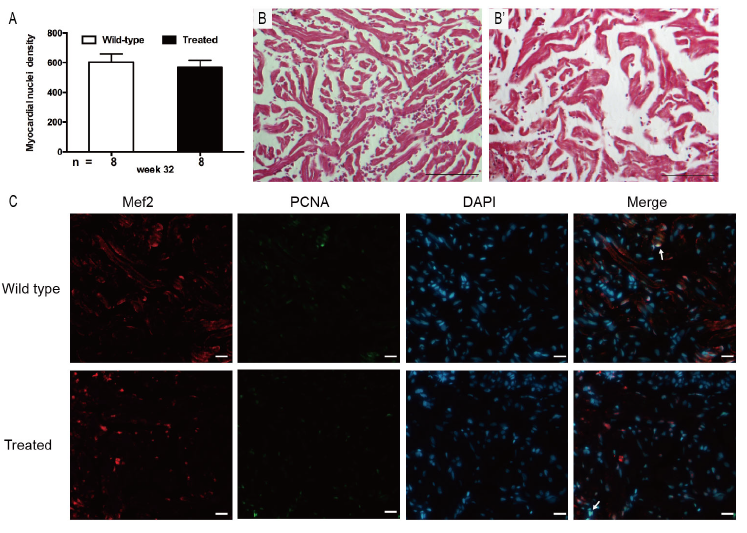
Fig. s1 Supplementary Figure 1. (A) Myocardial nuclei density, defined as number of myocardial nuclei per field to myocardial density, showing no difference in two groups at week 32 (p > 0.05). (B) Masson?s staining did not show any interstitial fibrosis in the two groups (n = 15 field, repeated five times); scale bar = 100?m. (C) Co-staining of PCNA (green), Mef2 (red) with DAPI (blue) on cryosections of adult zebrafish hearts, indicating no significant difference in PCNA staining between wild-type and treated group (n = 15 field, repeated five times); scale bar = 10?m?Arrows: PCNA+/Mef2+/DAPI+. (A) Bars represent mean ± standard error of the mean, n = number of fish examined.
Image
Figure Caption
Acknowledgments
This image is the copyrighted work of the attributed author or publisher, and
ZFIN has permission only to display this image to its users.
Additional permissions should be obtained from the applicable author or publisher of the image.
Full text @ Dis. Model. Mech.

