Fig. 6
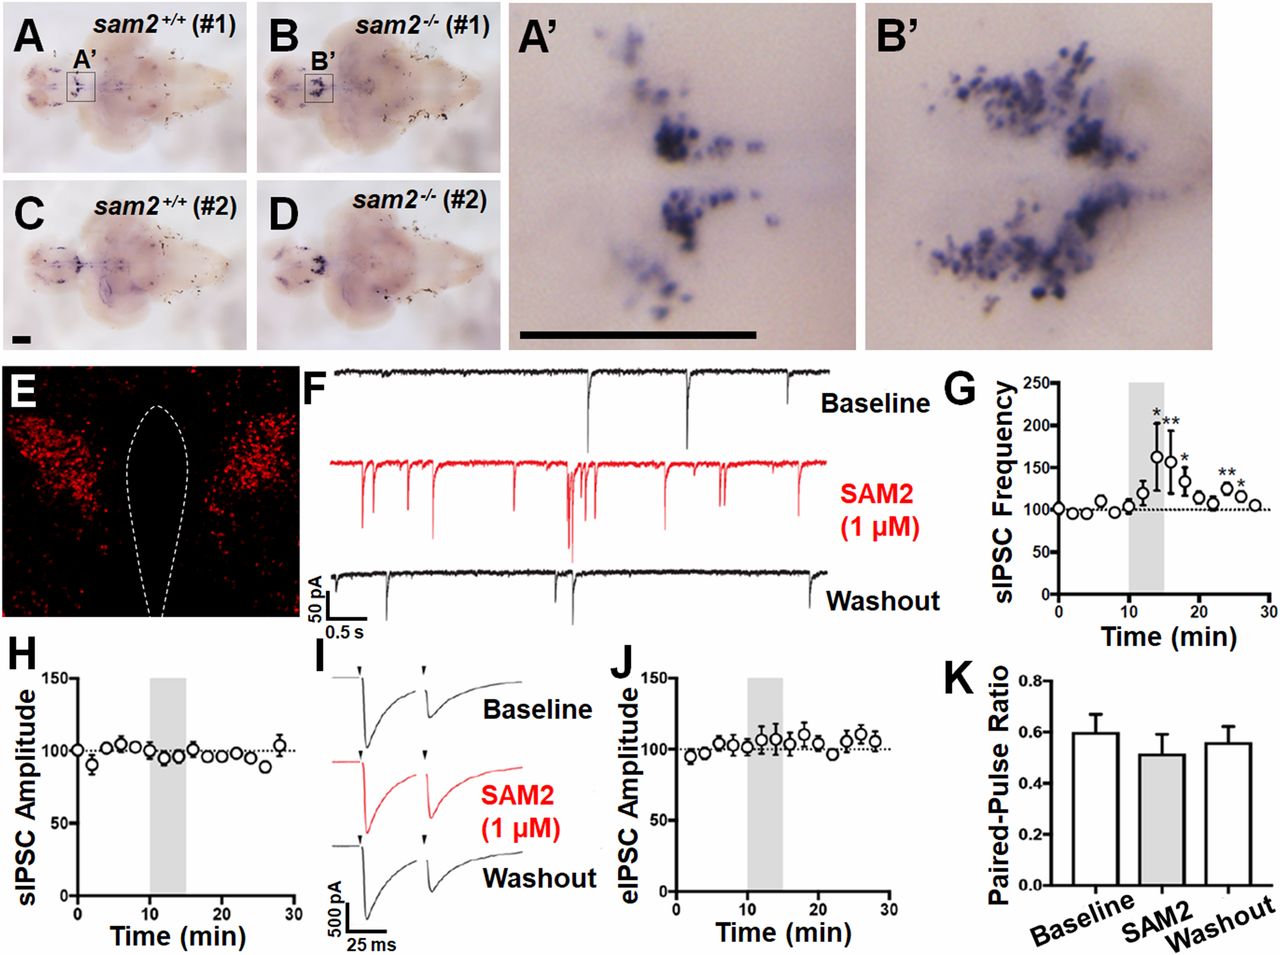
Increase of mRNA expression of stress-related crhb in sam2cnu1 KO fish and spontaneous inhibitory postsynaptic currents onto CRH neurons by SAM2. (A?D) Increase of crhb mRNA expression in sam2cnu1 KO fish (sam2+/+, n = 6; sam2?/?, n = 6). Ventral views of the whole brain of control sam2+/+ (A and C) and sam2?/? KO fish (B and D). (A? and B?) Higher magnifications of the boxed regions in A and B are the PPa in zebrafish, homologous to the mouse PVN. (Scale bars, 200 µm.) (E) Representative photomicrograph of the Cre-dependent TdTomato in the PVN CRH neurons. (Magnification: E, 10×.) (F) Representative voltage-clamp traces of sIPSCs in response to SAM2 application in PVN CRH neurons. (G) SAM2 application significantly increased sIPSC frequency. (H) SAM2 did not affect sIPSC amplitude. (I) Representative voltage-clamp trace of eIPSC onto CRH neurons in response to SAM2 application. (J) SAM2 did not affect the amplitude of eIPSCs. (K) SAM2 did not change the paired-pulse ratio. *P < 0.05; **P < 0.01.

