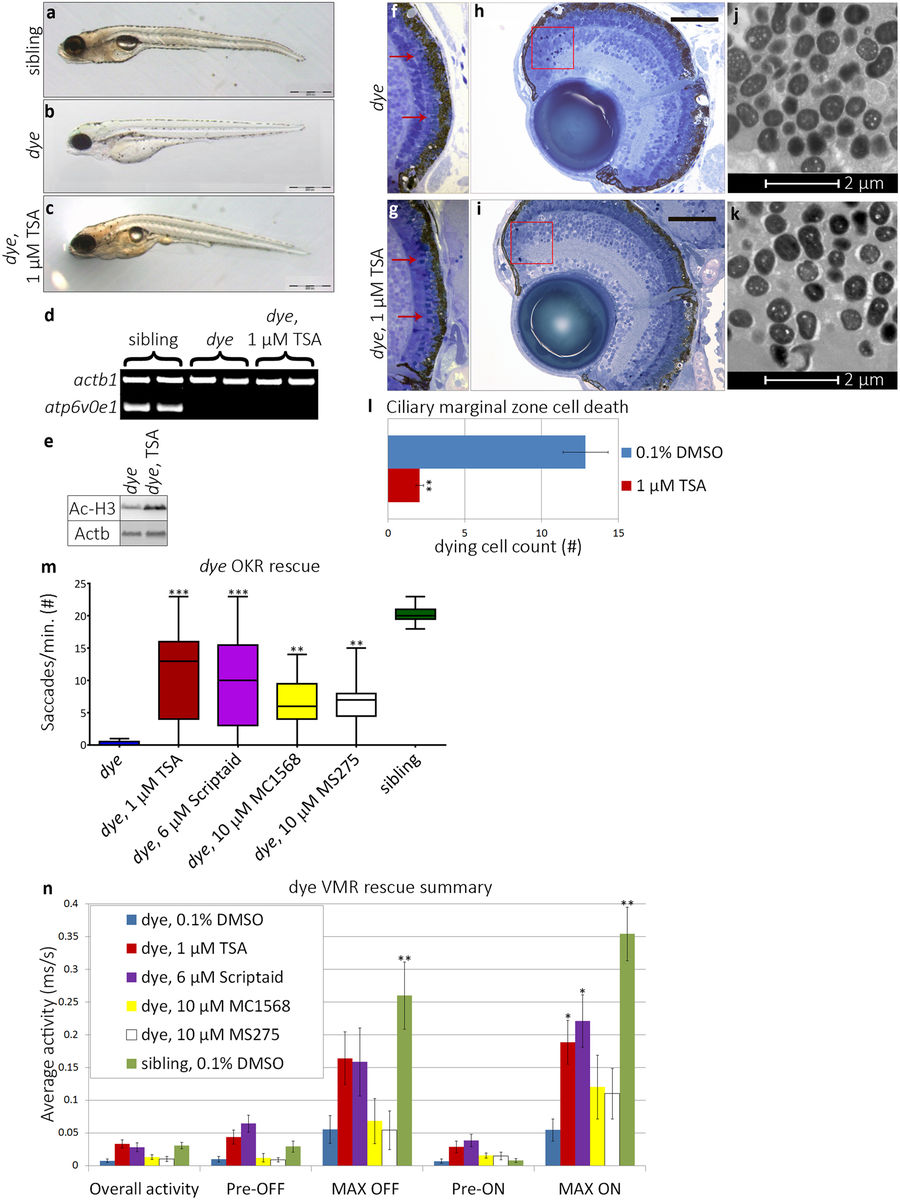
Fig. 3
HDACi treatment rescues morphological and visual behaviour defects in dye mutants. (a–c) Lateral bright field images of sibling control (a), dye mutant control (b) and 1 µM TSA treated dye (c). TSA treatment partially rescued gross morphological defects, restoring pigmentation, eye size and swim bladder inflation. Scale bars represent 500 µm scale. (d) The dye genotype was confirmed by the absence of a PCR product from the atp6v0e1 gene, B-actin served as a positive control. (e) Increased histone H3 acetylation was observed by western blot in TSA treated dye larvae compared to control. (f,g) Light micrographs of dye retinal sections. Photoreceptor outer segments are less visible in control treated dye (f) compared to 1 µM TSA treated larvae (g) (red arrows, f,h). (h,i) Cell death in the ciliary marginal zone is reduced in 1 µM TSA treated dye mutants (i), indicated by a reduction in the number of pyknotic nuclei present (red boxes) compared to dye mutant control (h), scale bars represent 100 μm scale. (j,k) Electron micrographs of ultra-thin (500 nm) dye retinal sections, 1 µM TSA treatment (k) does not significantly rescue RPE hypopigmentation or reduce the number of RPE cells that contain inclusion bodies in comparison to dye mutant controls (j). (l) The number of pyknotic nuclei through multiple sections from the central retina and individual larvae is significantly reduced, N = 5, n = 3. (j) HDACi treated dye mutants have significantly improved OKR following treatment, N = 12 (number of larvae per replicate), n = 3 (number of replicates). (k) Summary of VMR activities, 1 µM TSA and 6 µM Scriptaid significantly improve the MAX ON activity, N = 12, n = 3. Statistical analyses were performed using a Kruskal-Wallis one-way analysis of variance and post-hoc Dunn’s multiple comparison test, comparing each group to 0.1% DMSO treated dye mutants, error bars represent average SEM, ***p < 0.001, **p < 0.01, *p < 0.05. Full length agarose gels and western blots are included in the supplementary information (Supplementary Fig. S3b–d).

