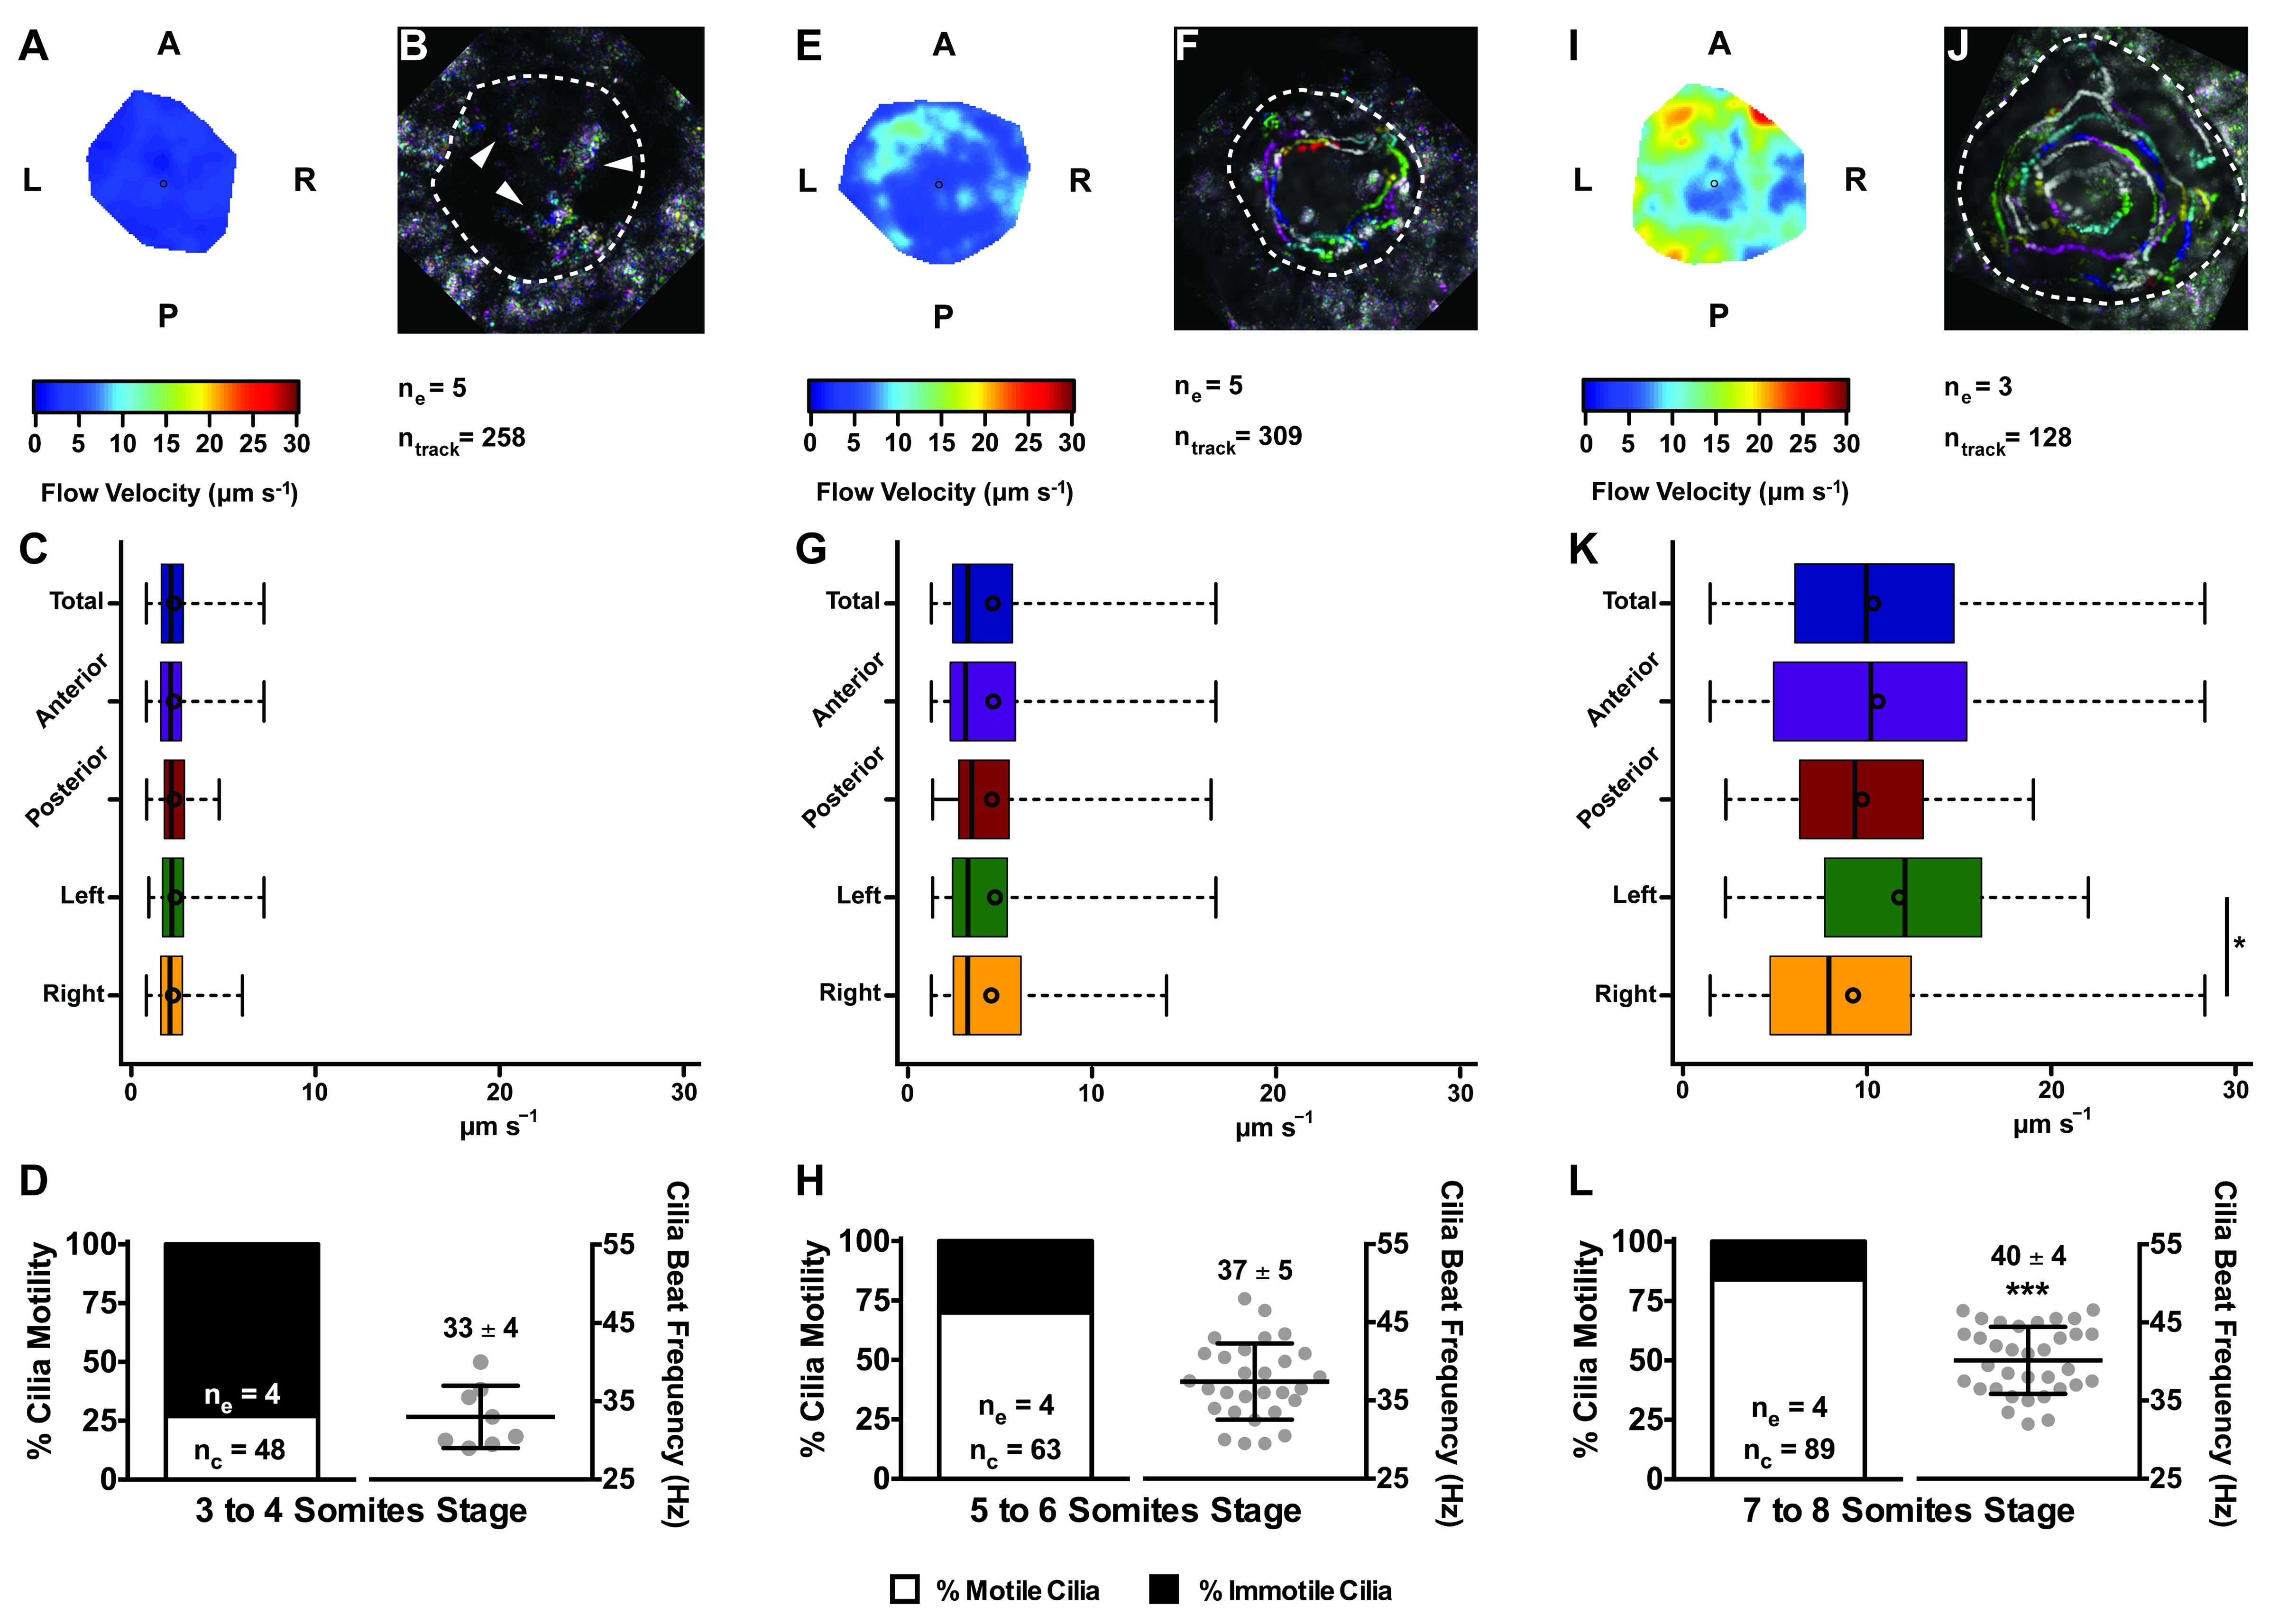
Fig. 2
Changes in KV flow and CBF through development observed in uninjected WT embryos.
Data was pooled from embryos at 3?4 (A?D), 5?6 (E?H), and 7?8 (I?L) somites stage. (A, E, I) Heat maps of flow speed showing detailed regions within the KV for pooled embryos in each experimental condition: 3?4 ss (A), 5?6 ss (E), and 7?8 ss (I). The pseudo-colour scale represents flow speed in ?m s?1, where red represents high speed versus low speed in blue. (B, F, J) Representative KV particle flow map for a WT embryo at 3?4 ss (B), 5?6 ss (F), and 7?8 ss (J). Each second is represented by a different colour. The particle Brownian motion in (B) is marked with white arrowheads. Anterior is to the top and Left is to left. (C, G, K) Box plots for instantaneous flow speed measured at different locations of the KVs, based on the same data set used to generate the heat maps, in each experimental condition: 3?4 ss (C), 5?6 ss (G), and 7?8 ss (K). Box plots display the median with a vertical line, and the whiskers represent the minimum and maximum values observed. Means are represented as small circles. *p<0.05, Wilcoxon test. (D, H, L) display the %motile and %immotile cilia found in the KV midplane (left panels) and the CBF measured in the motile cilia (right panels) of WT embryos in each experimental condition: 3?4 ss (D), 5?6 ss (H), and 7?8 ss (L). Values for CBF are Mean ąSD, ***p<0.001, ANOVA with Bonferroni's multiple comparisons test. ne ? number of embryos; ntracks ? number of tracks followed; nc ? number of cilia.

