Image
Figure Caption
Fig. S3
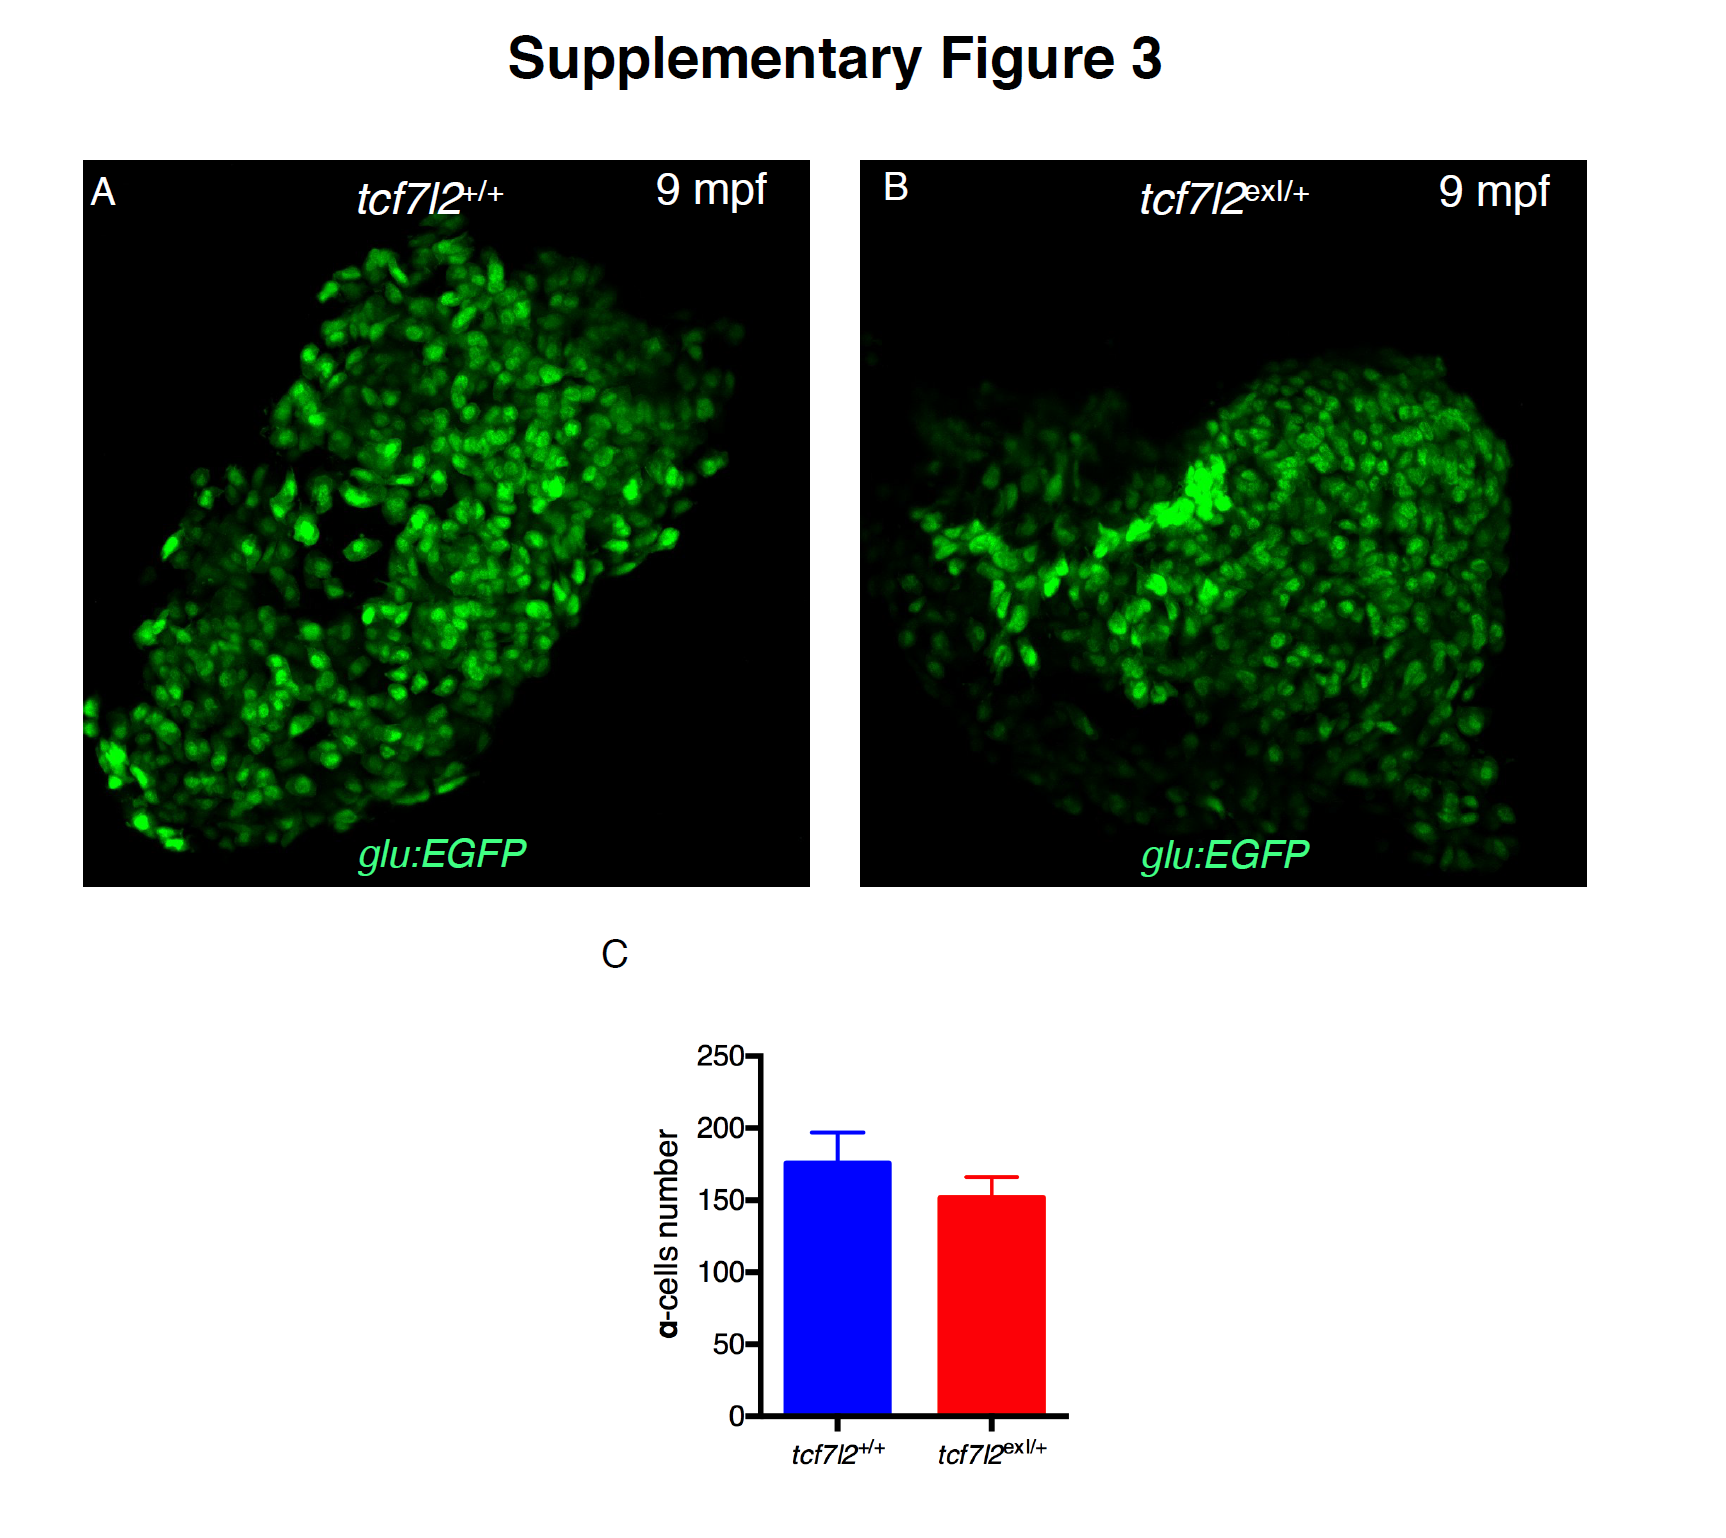
Impact of tcf7l2 deletion on ?-cell mass. Representative 2D images from wt and tcf7l2exI/+ pancreata extracted from 9 month-old fish in ? cell-specific Tg(glu:eGFP) background. (C) Quantification of ? cells in 9-month-old fish. No significant difference between genotypes was observed.
Acknowledgments
This image is the copyrighted work of the attributed author or publisher, and
ZFIN has permission only to display this image to its users.
Additional permissions should be obtained from the applicable author or publisher of the image.
Full text @ Sci. Rep.

