
|
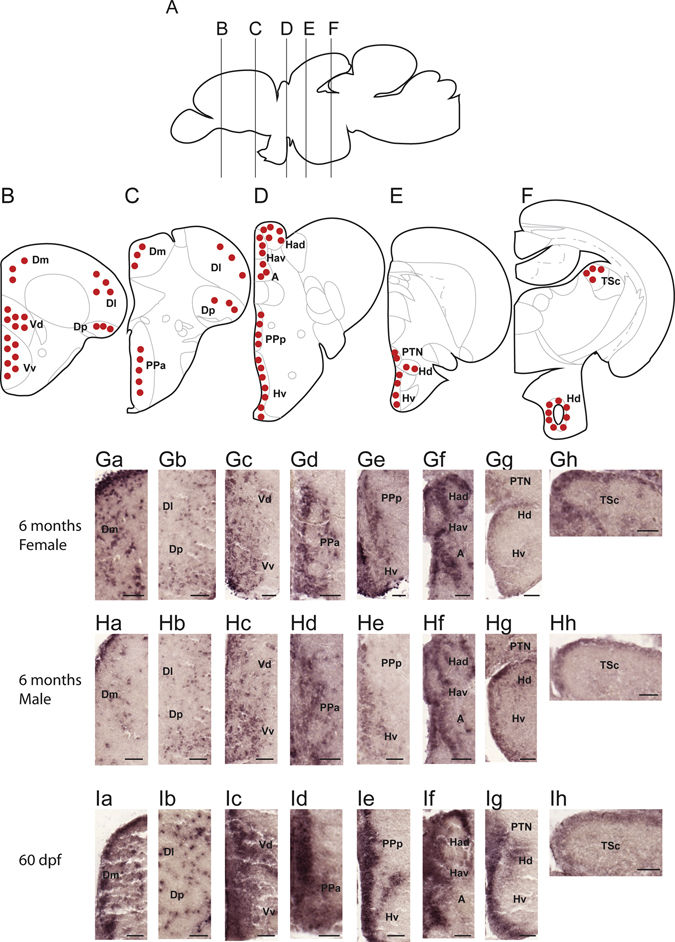
Fig. 1
Localisation of bpifcl mRNA expression in zebrafish brain. (A) Schematic sagittal drawing of the zebrafish brain. (B?F) Lines in A indicate levels of coronal sections. Schematic coronal brain drawing of zebrafish showing the distribution of bpifcl (red dots) mRNA-containing cells in the brain. (Ga?Gh) Photomicrographs of bpifcl-expressing cells in 6 months old female zebrafish brain. (Ha?Hh) Photomicrographs of bpifcl-expressing cells in 6 months old male zebrafish brain. (Ia?Ih) Photomicrographs of bpifcl-expressing cells in 60 days post-fertilisation (dpf) fish brain. For abbreviations, see Supplementary Abbreviation. Scale bar: 50 ?m.