Fig. S4
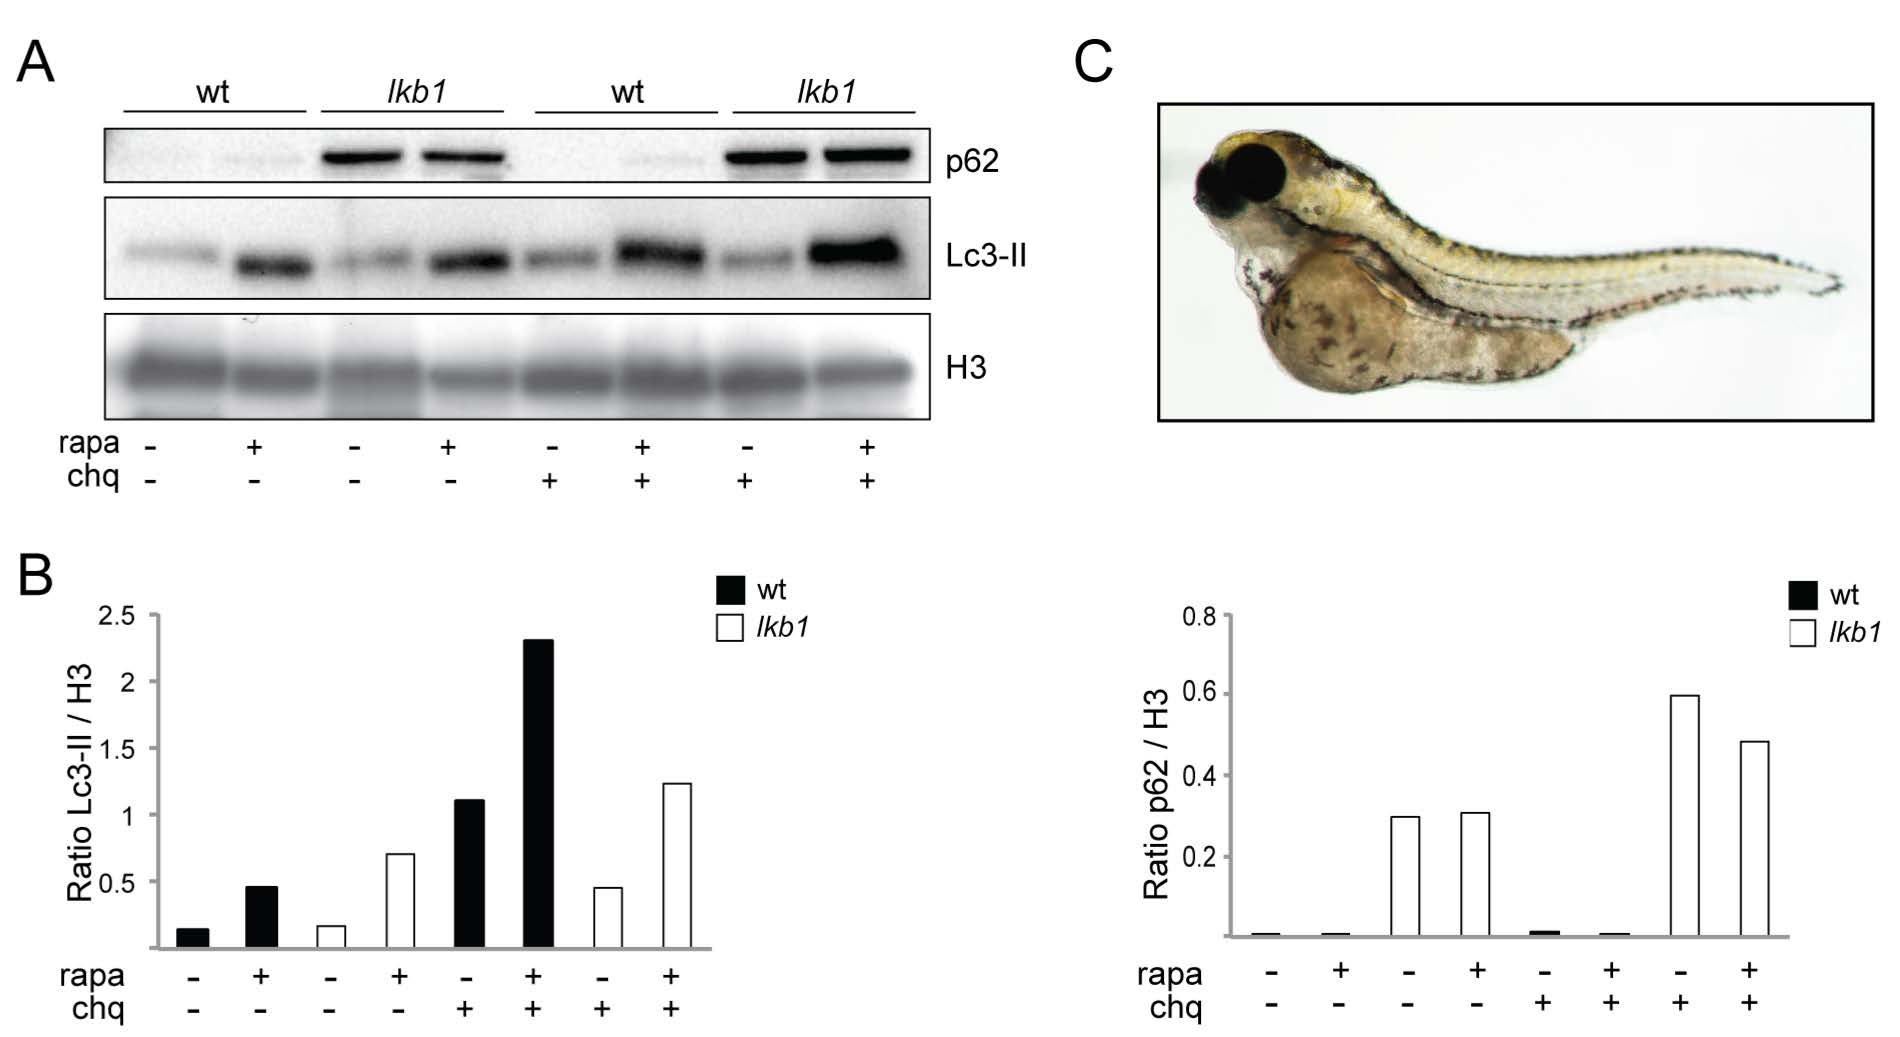
Rapamycin treatment leads to increased Lc3-II accumulation but does not restore p62 degradation in lkb1 mutants. (A) Western Blot analysis of p62, Lc3-II, and Histone H3 (loading control) in total protein lysates of wt and lkb1 trunks at 6 dpf that were treated with either 10 ?M rapamycin from 1 dpf or DMSO (negative control). To detect the autophagic flux the larvae were treated or not with 2.5 ?M chloroquine for 14 h prior to processing. Rapamycin treatment leads to increased Lc3-II levels in both wt and lkb1 larvae, but p62 levels remained high in the lkb1 mutants. Uncropped images of the blots are shown in Supplementary Figure S9B. (B) Graphical representation of the data shown in (A), depicting the densitometric p62/H3 and Lc3-II/H3 ratios. (C) Representative image of a wt larva at 6 dpf that has been treated with 10 ?M rapamycin from 1 dpf onwards. Note the high amount of yolk still present indicating developmental delay.

