Fig. 7
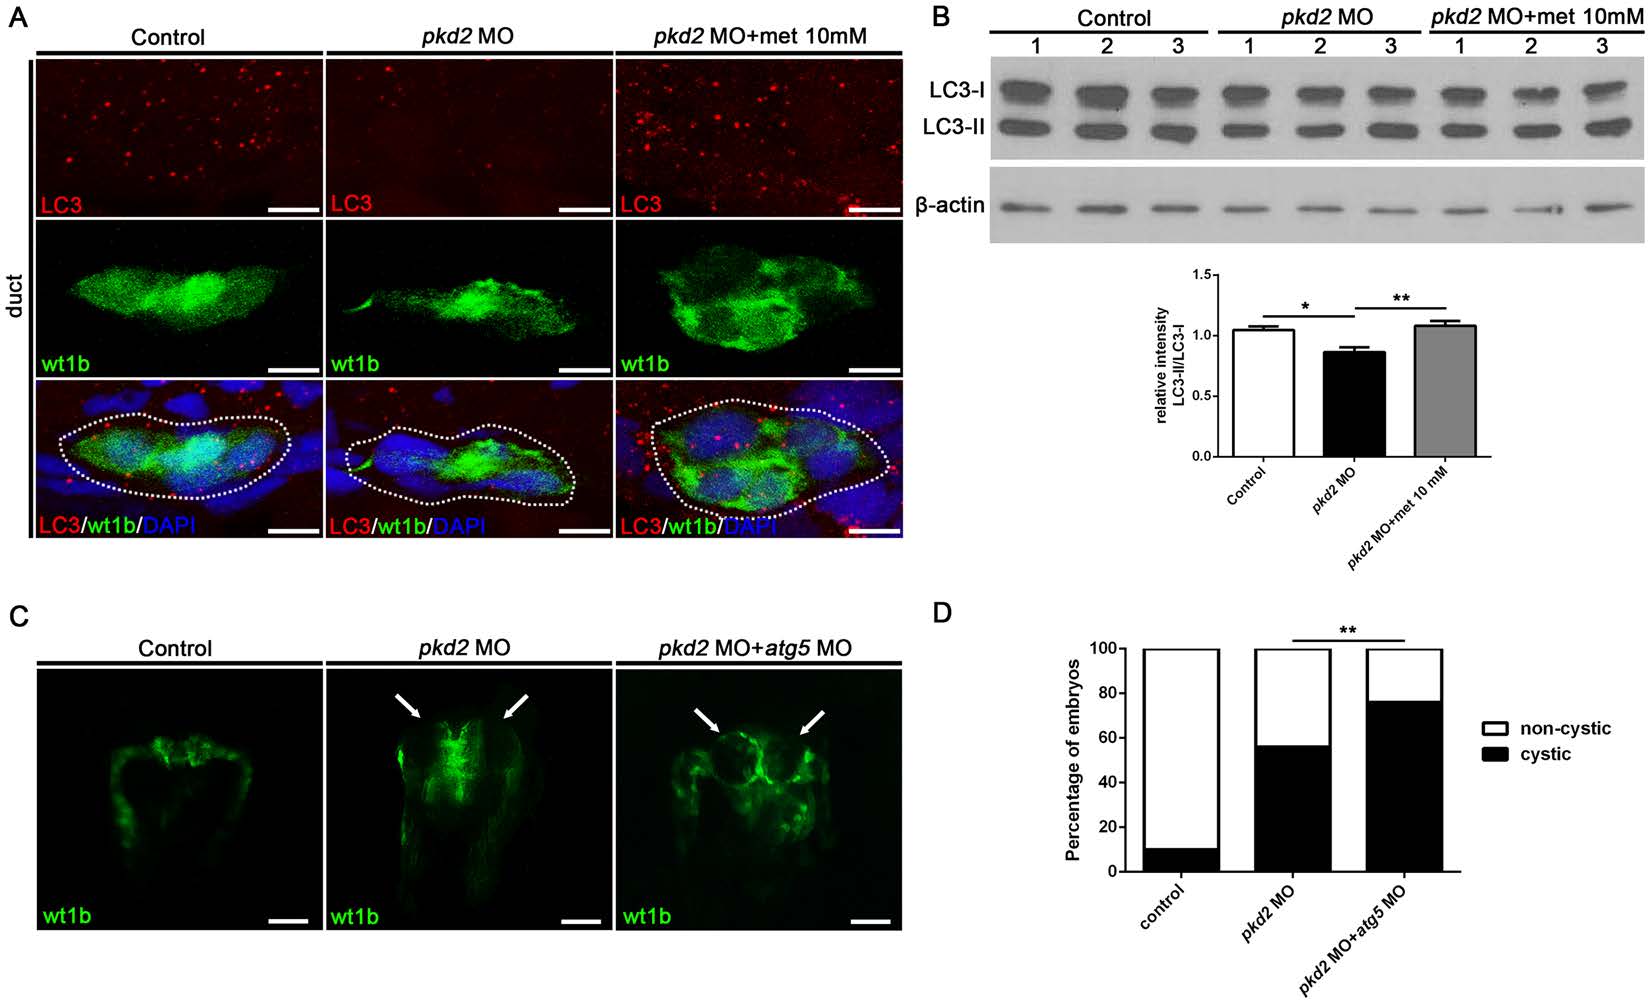
Metformin enhances autophagy in Tg(wt1b:GFP) pkd2 morphants. (A) Representative confocal images of pronephric ducts (green, wt1b:GFP) in control MO-injected embryos, pkd2 morphants, and pkd2 morphants treated with metformin (10?mM) at 48 hpf (n?=?4 per group). Transverse cryosections were stained for LC3 (red), and the nuclei were counterstained with DAPI (blue). Note the reduced expression of LC3 (orange dots, red and green merged) in the pkd2 morphant and the rescue effect of metformin treatment. The dotted circle indicates the pronephric duct. Scale bar, 10?Ám. (B) Quantification of the expression of LC3-II relative to LC3-I through Western blot analysis of total embryo lysates. ▀-actin was used as a loading control; n?=?8 from four independent experiments. *P?<?0.05 compared with control; **P?<?0.01 compared with untreated pkd2 morphants. The uncropped blots are shown in Supplementary Fig. S2. (C) A combined knockdown of atg5 and pkd2 increased the frequency of cystic phenotype in the Tg(wt1b:GFP) pkd2 morphants. Representative images of the pronephros in the control embryos, pkd2 morphants, and atg5/pkd2 double morphants are shown. Arrows indicate the pronephric cysts. (D) Comparison of the cystic phenotype in different groups. Data represent four independent experiments (n?=?81, 86, and 87 per group). **P?<?0.01.

