
|
Fig. S1
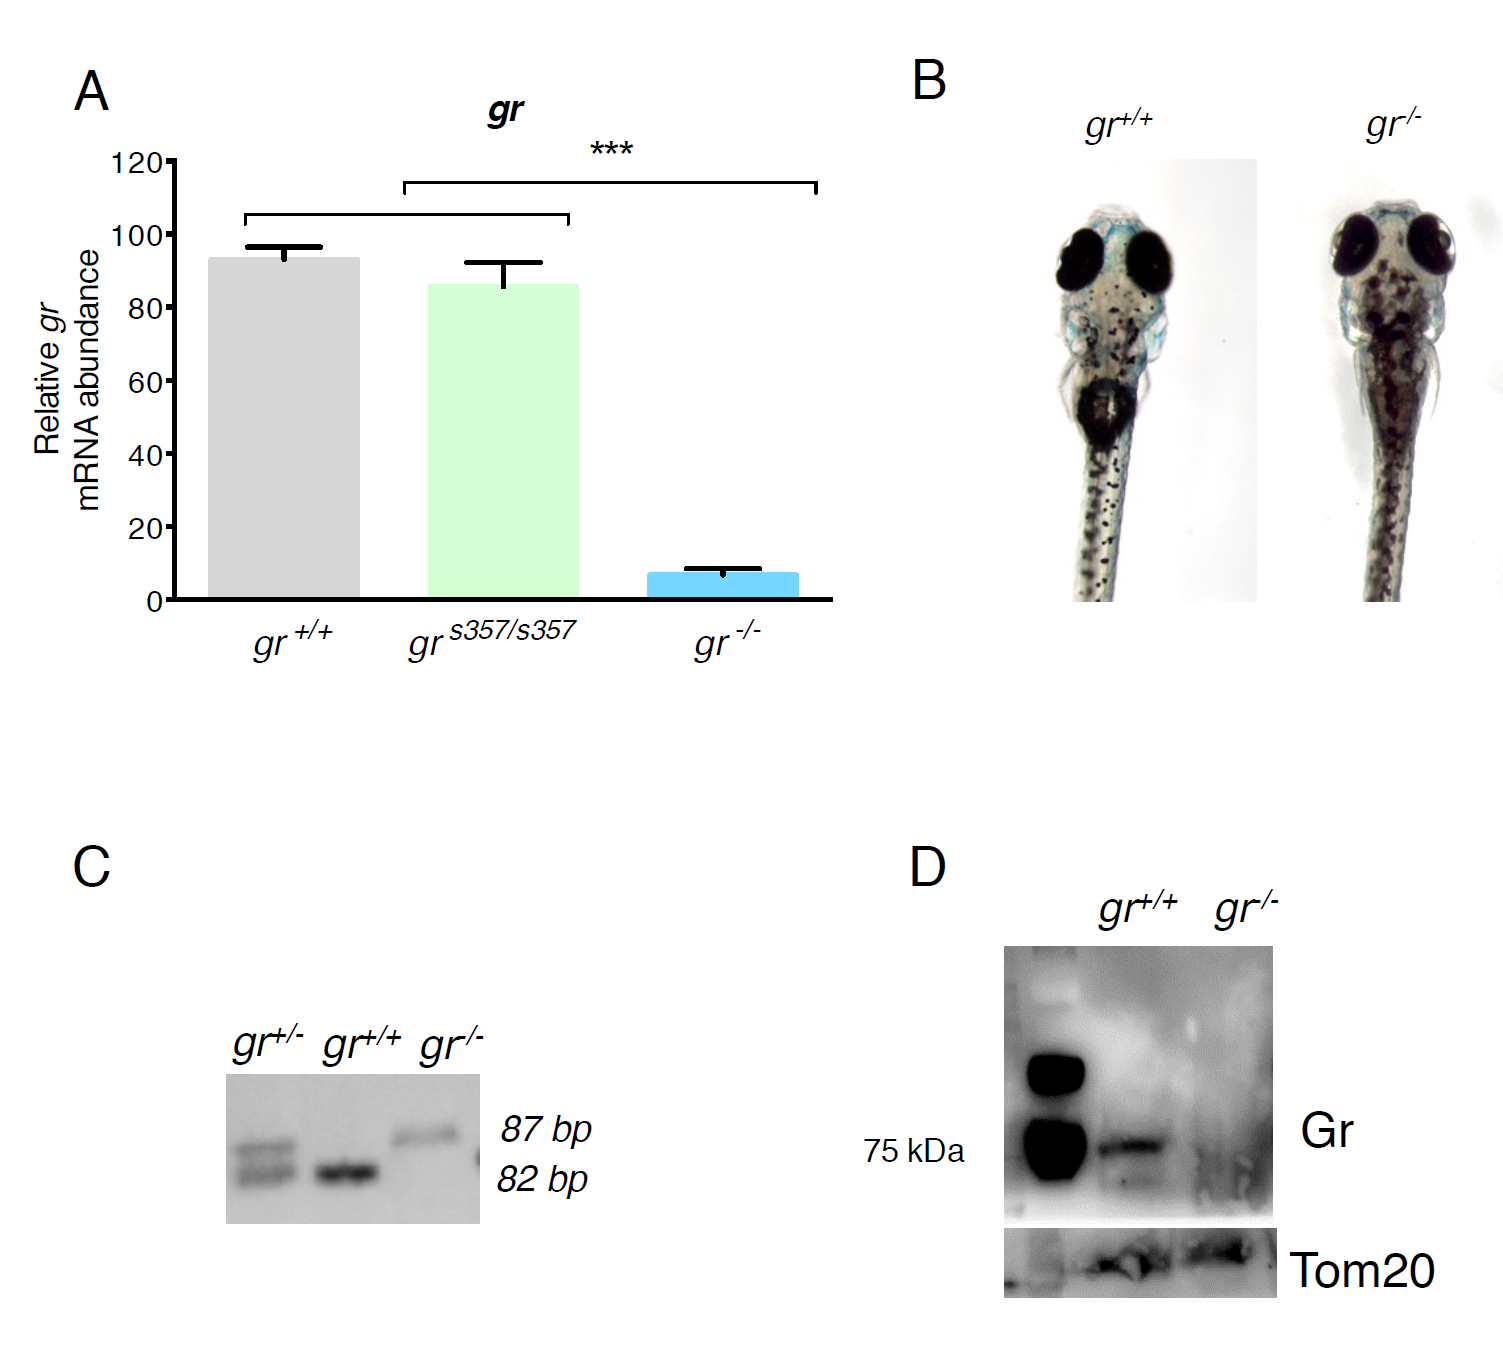
(A): qRT-PCR of gr mRNA in 5-dpf mutant larvae compared to control shows a statistically significant reduction of gr expression. Values represent the mean � SEM. Asterisks indicate that expression levels are significantly different from the control: ***P < 0.001. Data were generated from four biological replicates. (B): Representative images of 5-dpf control gr+/+ and mutant gr-/- larvae after exposure to VBA stimulus. gr-/- mutants appear darker in comparison to control. (C): Representative gel image of PCR genotyping using genomic DNA from tail fins of adults born from a cross between gr heterozygotes. (D): Western blot of liver proteins from 8-month-old gr-/- and gr+/+ zebrafish showing disappearance of the protein band with respect to control.