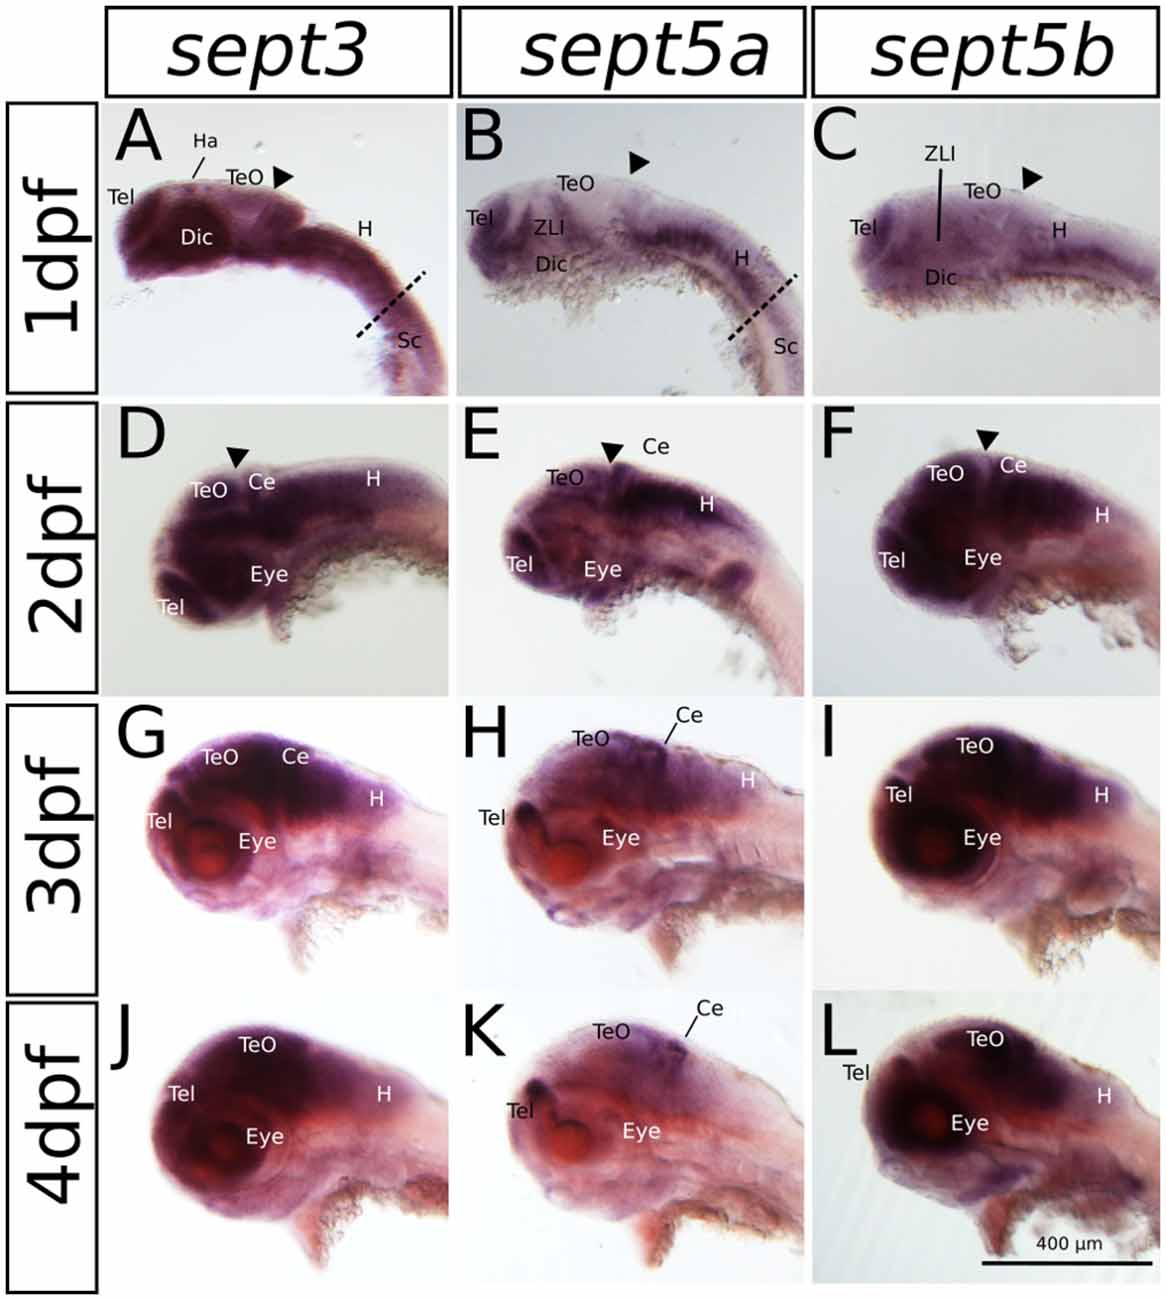
Fig. 2
The expression pattern of sept3, sept5a and sept5b in 1?4 dpf zebrafish larvae in a lateral view. Sept3, sept5a and sept5b expression is shown by ISH, the blue color indicates the cells expressing the mRNA of each septin. The expression of sept3 is shown in 1 dpf (A), 2 dpf (D), 3 dpf (G) and 4 dpf (J) zebrafish larvae. Sept5a expression is shown in 1 dpf (B), 2 dpf (E), 3 dpf (H) and 4 dpf (K) larvae. Zebrafish larvae 1?4 dpf stained with the sept5b probe are shown in (C,F,I,L). The telencephalon (Tel), habenula (Ha), diencephalon (Dic), the zona limitans intrathalamica (ZLI), cerebellum (Ce), tectum (TeO), eye, the spinal cord (Sc) as well as the hindbrain (H) are labeled. The border between hindbrain and spinal cord is marked by a dashed line. The midbrain-hindbrain boundary (MHB) is labeled (black arrowhead).

