
Fig. 12
|
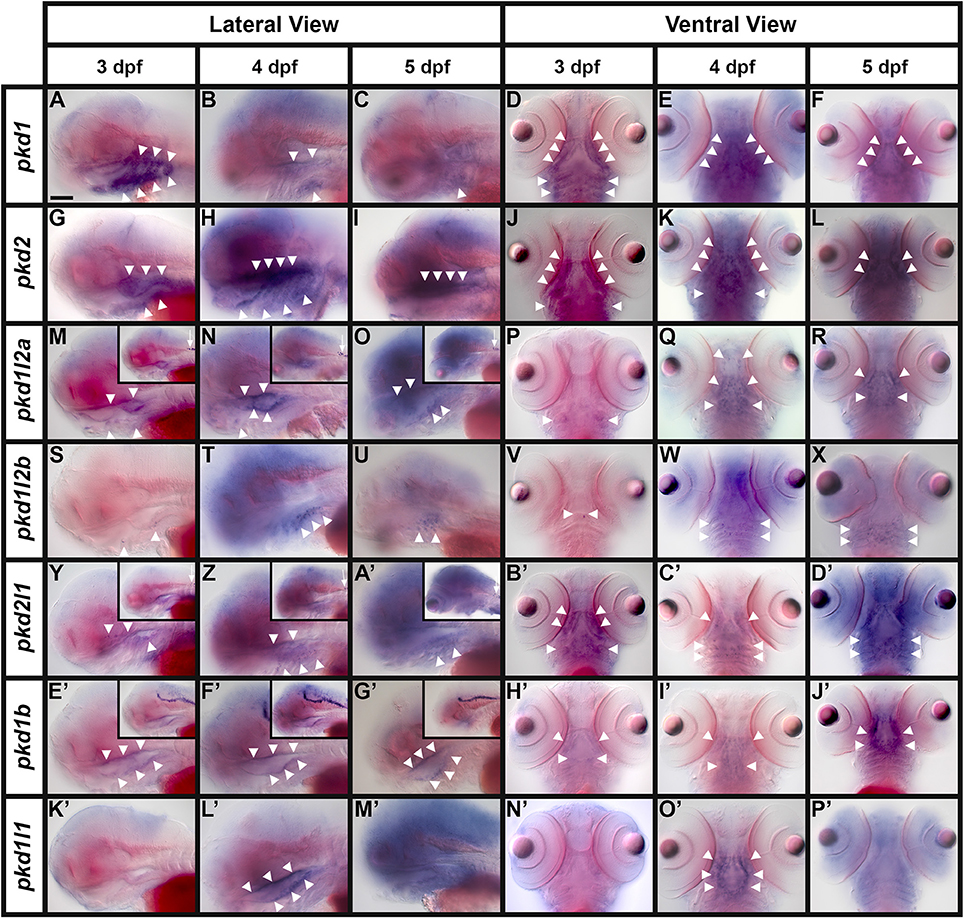
Fig. 12
Expression of pkd genes in taste bud regions. Lateral (A?C,G?I,M?O,S?U,Y,Z,A',E'?G',K'?M') and ventral (D?F,J?L,P?R,V?X, B'?D',H'?J',N'?P') views of pkd gene expression at 3, 4, and 5 dpf. Rostral is left Rostral is left (A?C,G?I,M?O,S?U,Y,Z,A',E'?G',K'?M') and top (D?F,J?L,P?R,V?X,B'?D',H'?J',N'?P'). In most of the lateral views, the eyes are out of focus. Insets in (M?O) and (Y?A') show expression of pkd1l2a and pkd2l1 in KA cells in the rostral spinal cord (small white arrows). Insets in (E'?G') show expression of pkd1b in the floor plate of the midbrain and hindbrain. White arrowheads indicate the locations of pharyngeal expression. Scale bar (A) = 100 ?m.