
|
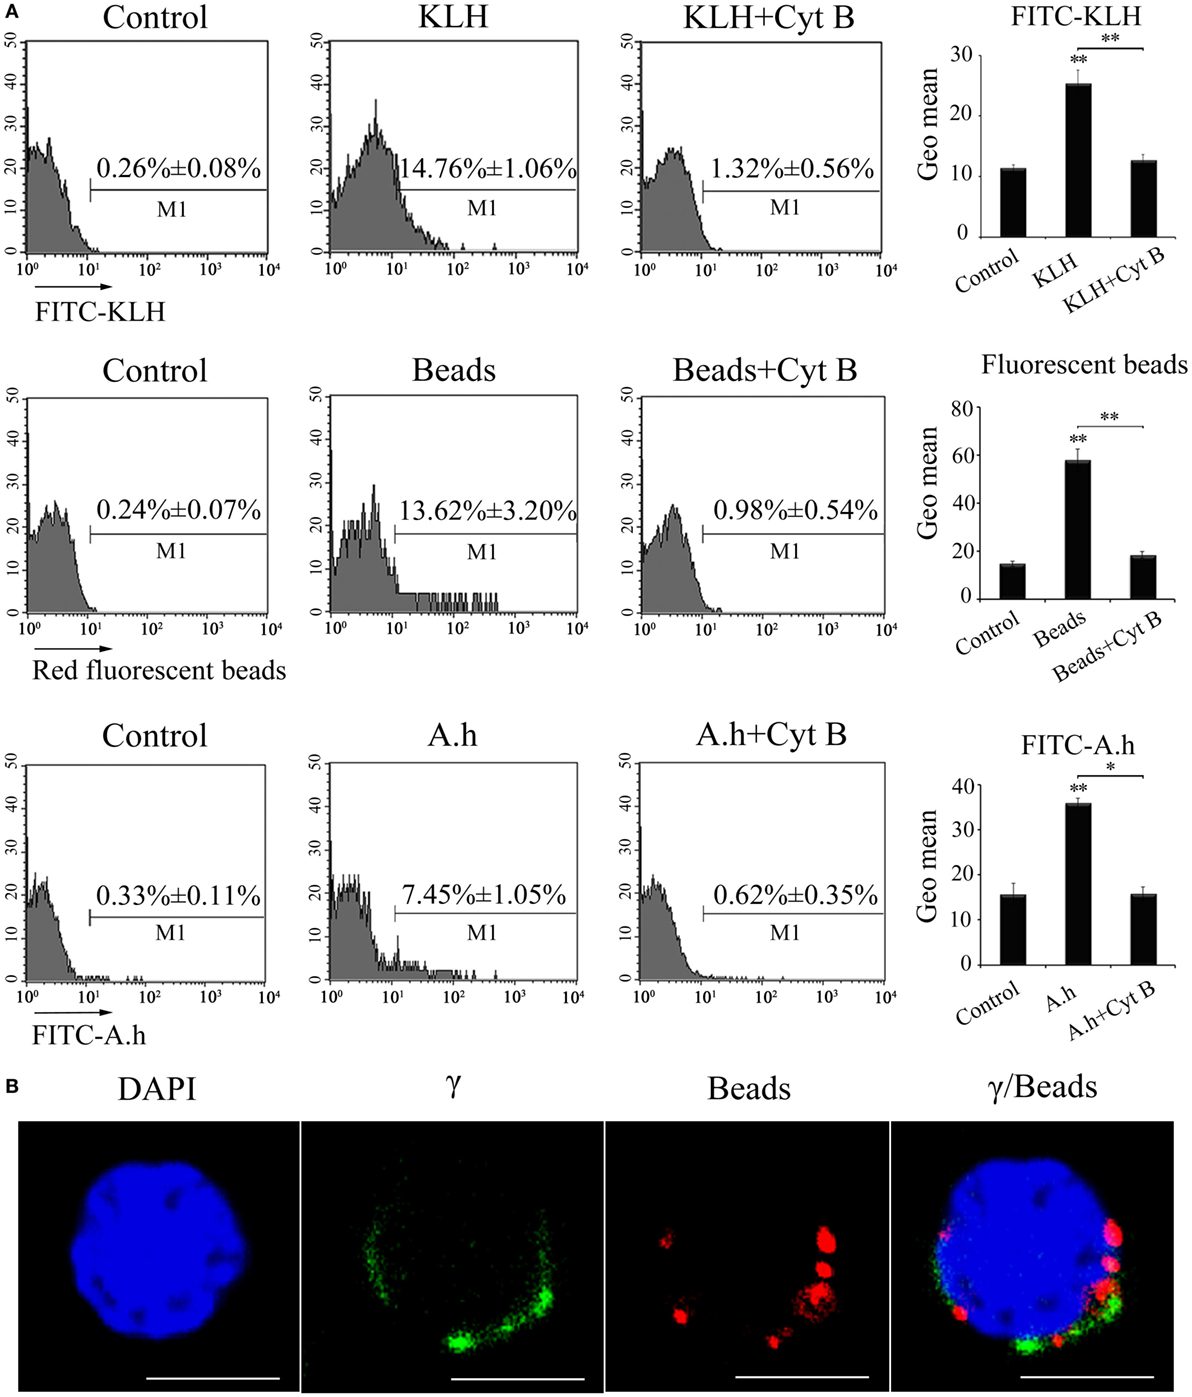
Fig. 4
Phagocytic ability of zebrafish ?? T cells. (A) FCM detected the phagocytic ability. ?? T cells were magnetically sorted and incubated with FITC-KLH, 1 �m red fluorescent latex beads or FITC-A.h at 28�C for 4 h. Cells in control group for active phagocytosis were incubated in ice. In parallel, ?? T cells incubated with FITC-KLH, red fluorescent beads, and FITC-A.h (28�C for 4 h) in the presence of cytochalasin B were set as controls. The numbers above the marker bars in each panel indicate the percentages of phagocytic ?? T cells. The geometric means of the fluorescence intensities computed from the outlined region represent the phagocytic ability of ?? T cells in each treatment group. Means � SD of three independent experiments are shown. *P < 0.05, **P < 0.01. (B) Confocal microscopy of 1 �m red fluorescent latex beads by ?? T cells. DAPI stain showed the location of the nuclei. Original magnification �630. Scale bar, 5 �m.