
|
Fig. 4 S7
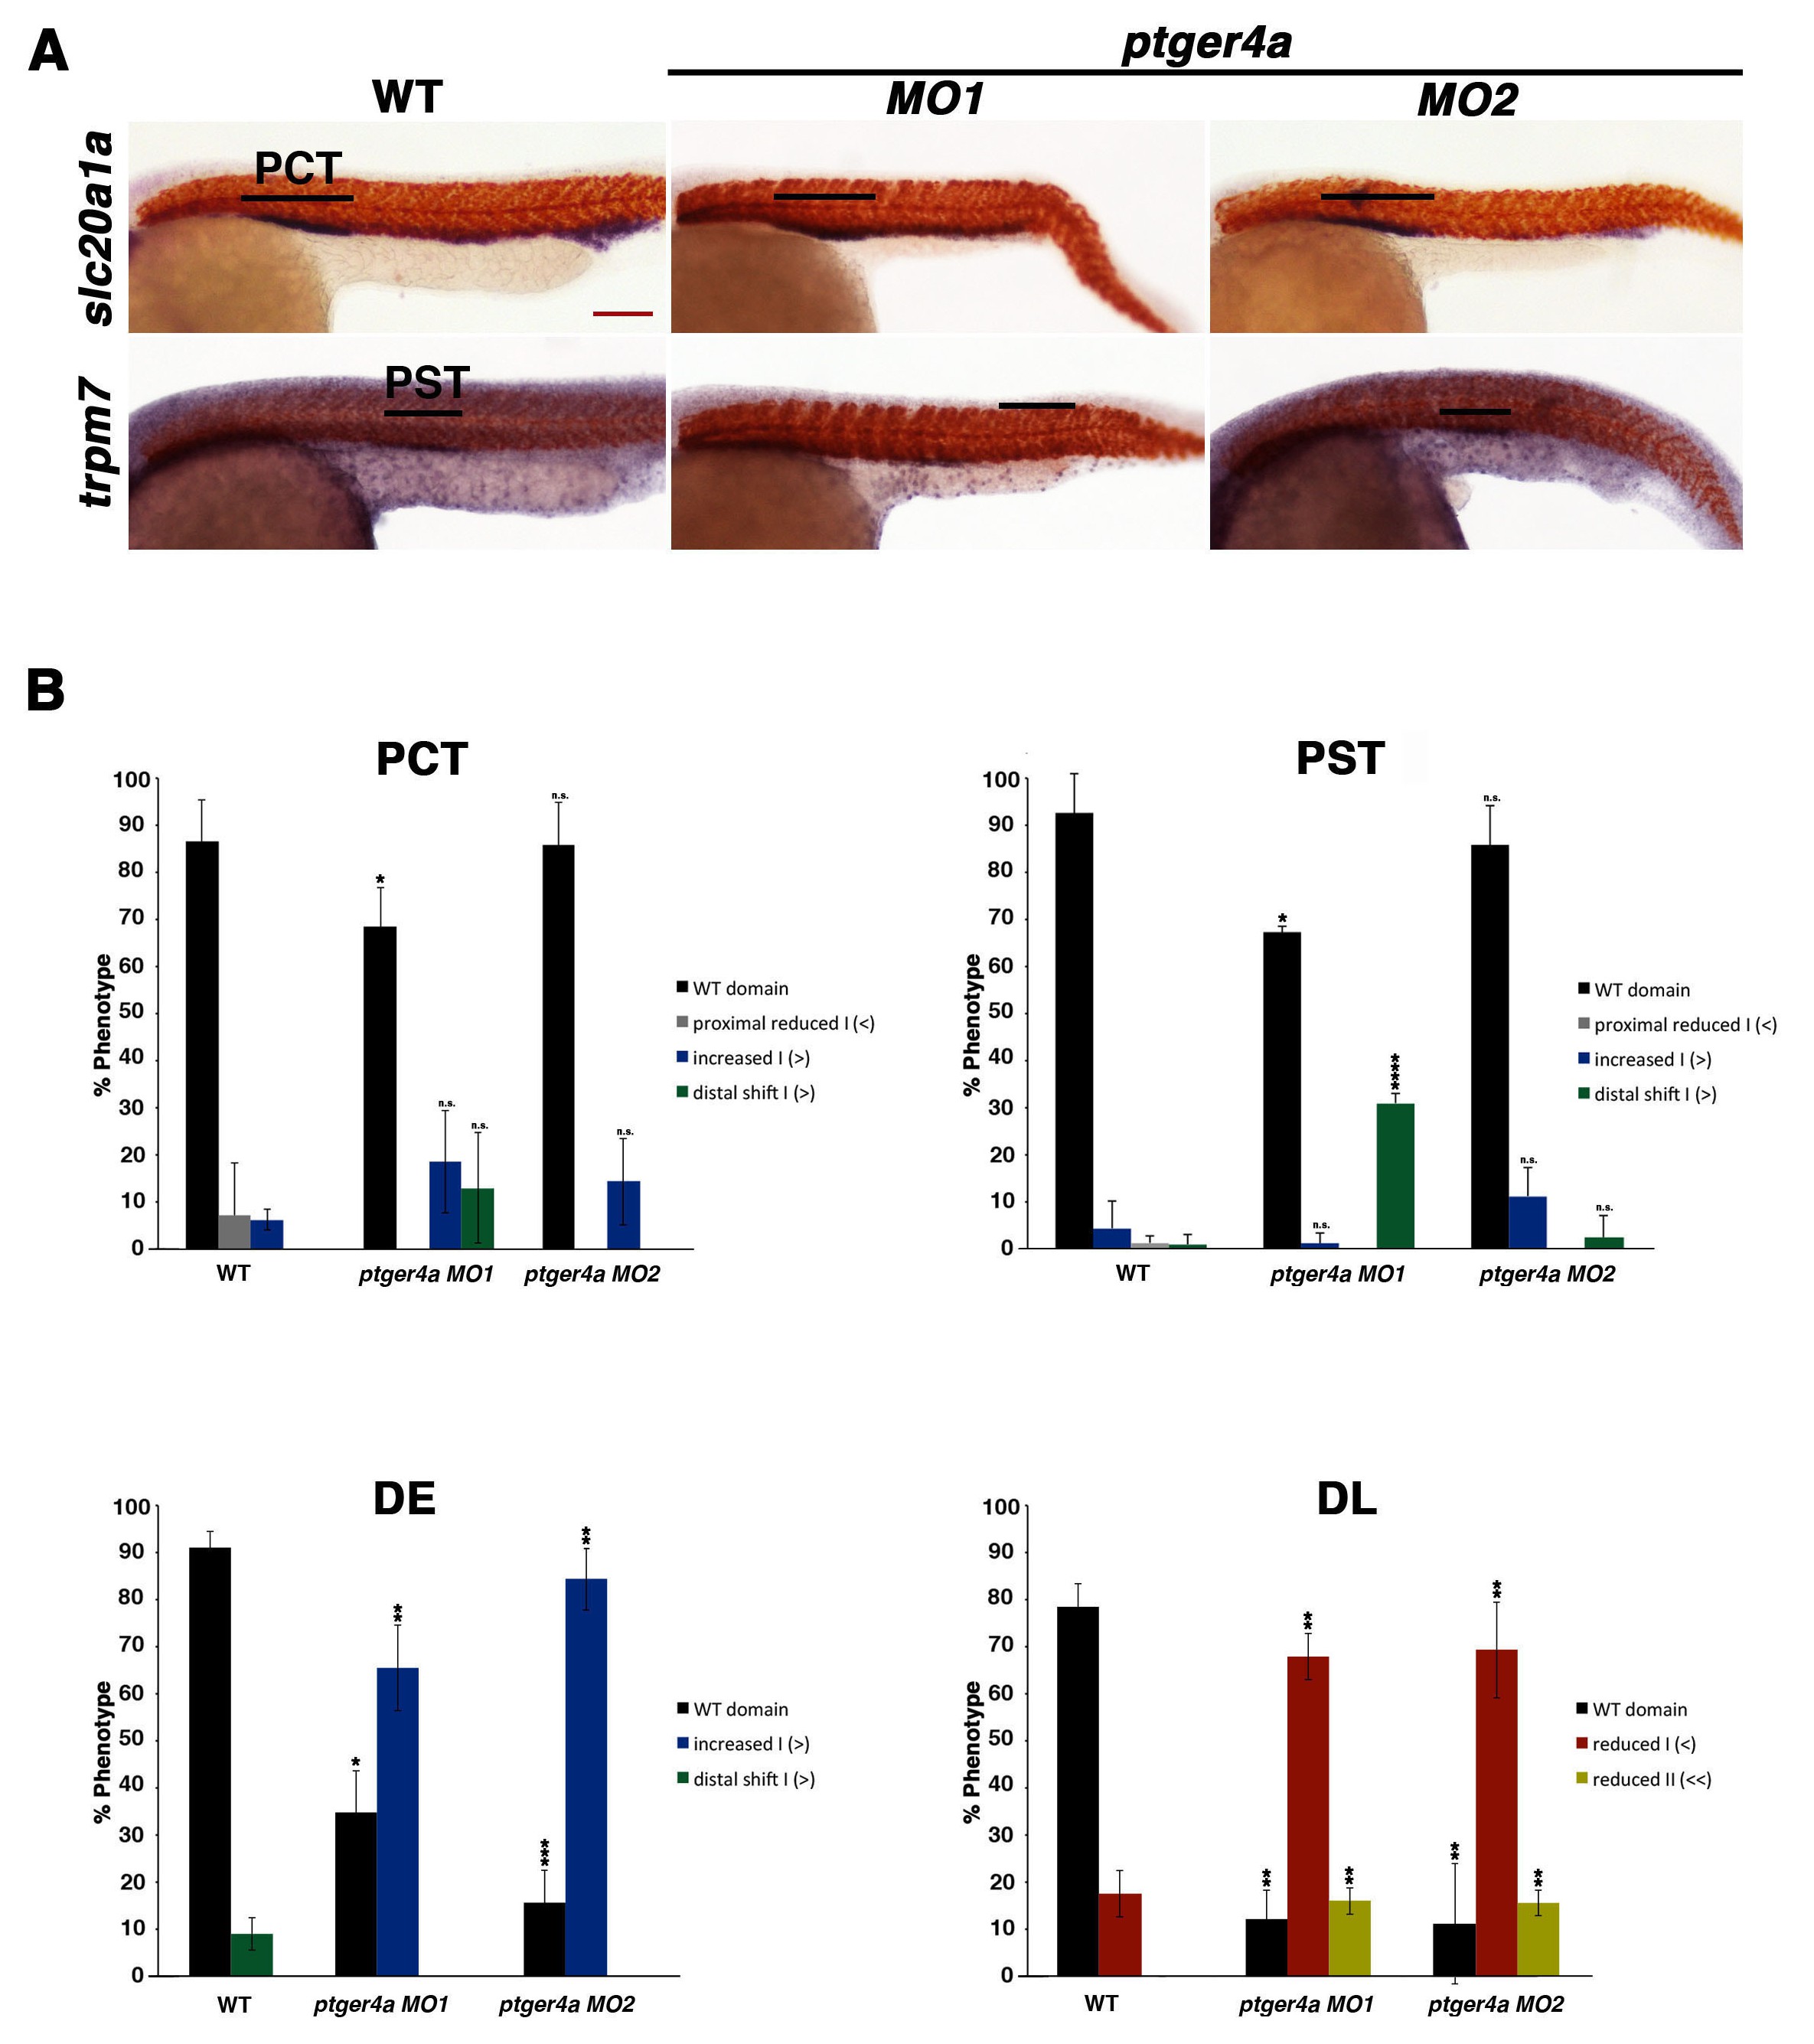
ptger4a MO knockdown results in an expansion of the distal early segment.
(A) Embryos were microinjected with ptger4a MO1 or ptger4a MO2 and grown until 24 hpf. Embryos were stained for the PCT (slc20a1a), PST (trpm7), (purple) and the somites (smyhc1) (red) using WISH at the 24 hpf stage. Black bars indicate segment gene expression domain. Red scale bar, 70 �m. (B) The PCT, PST, DE, and DL were quantified in triplicate using parallel somites to categorize phenotypes. Greater than (>) and less than (<) were used to categorize embryos, where each (>) or (<) represents the difference of a somite in the pertinent segment area. At least 20 embryos were used for each control and experimental group. Data are represented as � SD significant by t test comparing each drug treatment to the corresponding DMSO control group, *p<0.05, **p<0.005, ***p<0.0005, ****p<0.00005, where n.s. indicates not significant.