
Image
|
Figure Caption
Fig. S5
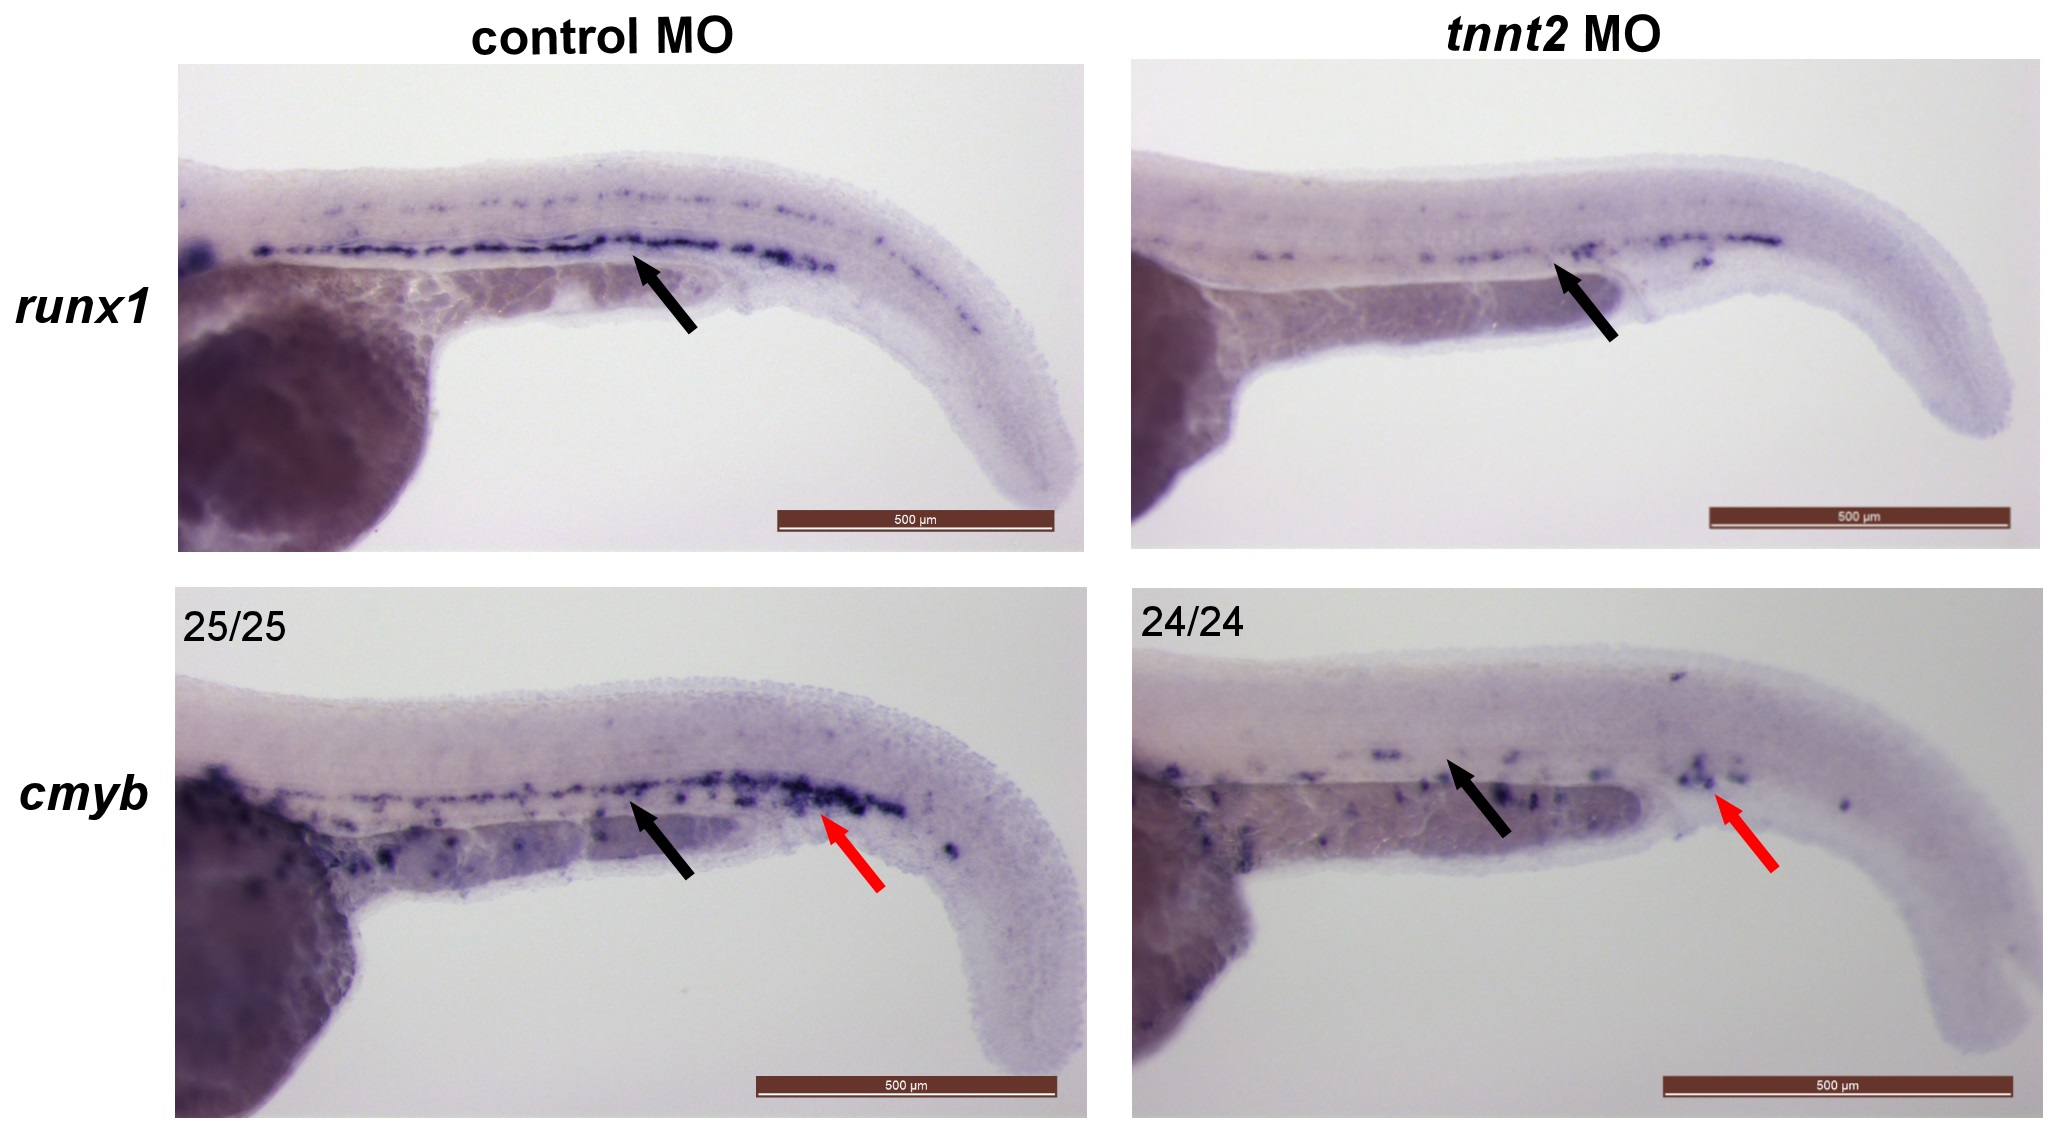
Expression of HSC markers runx1 and cmyb is blood flow dependent.
Expression patterns of HSC markers runx1 (top panel) and cmyb (bottom panel) is significantly diminished in the tnnt2 morphants which lack blood flow confirming previously published data [19]. Black arrows indicate the aorta-gonad-mesonephros (AGM) region and red arrows indicate caudal haematopoietic tissue (CHT). Numbers in the top left corners indicate number of embryos with similar staining patterns out of total number of embryos examined. Scale bar = 500?m.
Figure Data
Acknowledgments
This image is the copyrighted work of the attributed author or publisher, and
ZFIN has permission only to display this image to its users.
Additional permissions should be obtained from the applicable author or publisher of the image.
Full text @ PLoS One