Fig. 3
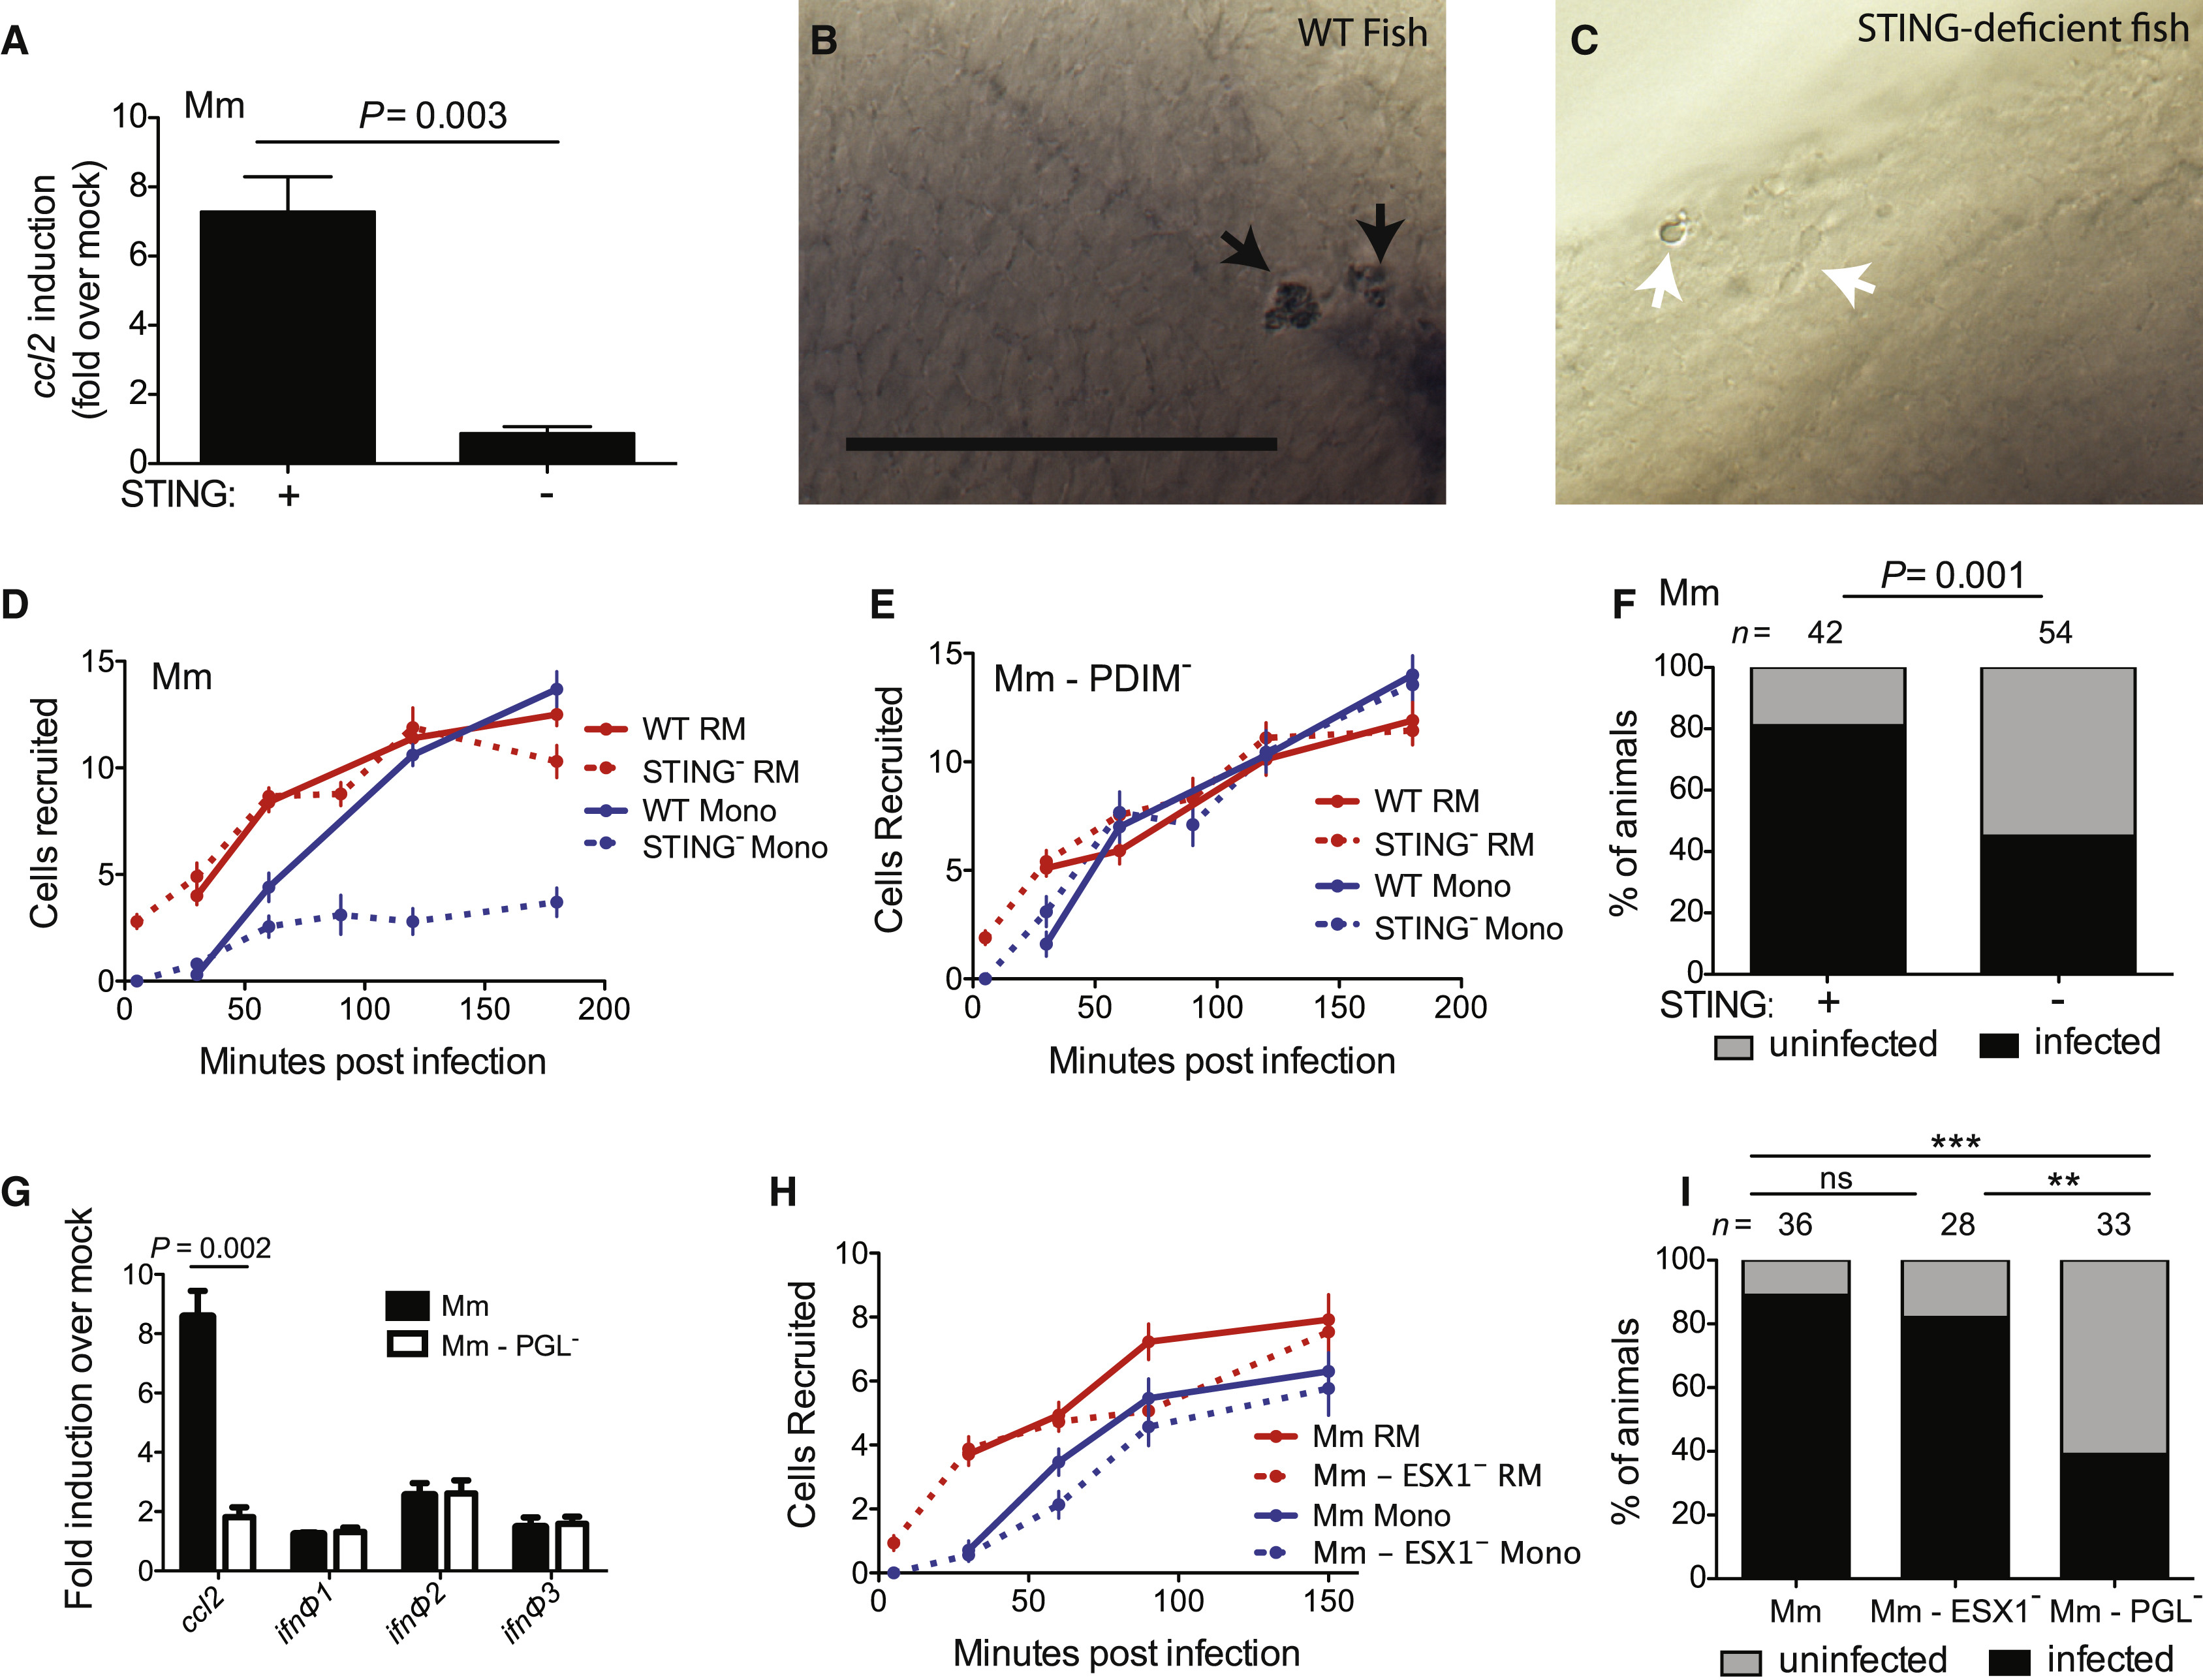
Mm PGL Recruits Monocytes through STING-Dependent ccl2 Induction
(A) ccl2 messenger RNA levels (mean ± SEM of three biological replicates) induced at 3 hr after caudal vein infection of 2 dpf wild-type or Sting-deficient fish with 250?300 wild-type Mm. Student?s unpaired t test.
(B and C) In situ hybridizations against zebrafish ccl2 mRNA following hindbrain ventricle infections with 80 wild-type Mm into wild-type (B) or Sting-deficient (C) zebrafish. Black arrows, ccl2 mRNA-positive phagocytes; white arrows ccl2 mRNA-negative phagocytes. Scale bar, 50?m. Results representative of three independent experiments.
(D) Mean resident macrophage and monocyte recruitment from 5 to 180 mpi in the HBV of wild-type or Sting-deficient fish after infection with 80 wild-type Mm.
(E) Mean resident macrophage and monocyte recruitment from 5 to 180 mpi in the HBV of wild-type or Sting-deficient fish after infection with 80 Mm - PDIM-.
(F) Percentage of infected (black) or uninfected (gray) wild-type or Sting-deficient fish 5 dpi with 1-3 wild-type Mm into the HBV. n = number of larvae per group. Results representative of two independent experiments. Significance testing done using Fisher?s exact test.
(G) ccl2, ifn?1, ifn?2, and ifn?3 mRNA levels (mean ± SEM of three biological replicates) induced at 3 hr after caudal vein infection of 2 dpf wild-type fish with 250?300 wild-type Mm. Significance testing done using Student?s unpaired t test for each gene. p = 0.002 for ccl2, all other comparisons not significant.
(H) Mean resident macrophage and monocyte recruitment from 5 to 150 mpi in the HBV of wild-type fish after infection with 80 wild-type or ESX-1-deficient (ESX1?) Mm.
(I) Percentage of infected (black) or uninfected (gray) wild-type fish 5 dpi of 1?3 wild-type, ESX1?, or PGL? Mm into the HBV. n = number of larvae per group. Significance testing done using Fisher?s exact test for comparisons shown. ??p < 0.01, ???p < 0.001. Results representative of two independent experiments.
Results in (D), (E), and (H) representative of three independent experiments.
Reprinted from Immunity, 47(3), Cambier, C.J., O'Leary, S.M., O'Sullivan, M.P., Keane, J., Ramakrishnan, L., Phenolic Glycolipid Facilitates Mycobacterial Escape from Microbicidal Tissue-Resident Macrophages, 552-565.e4, Copyright (2017) with permission from Elsevier. Full text @ Immunity

