Image
Figure Caption
Fig. S2
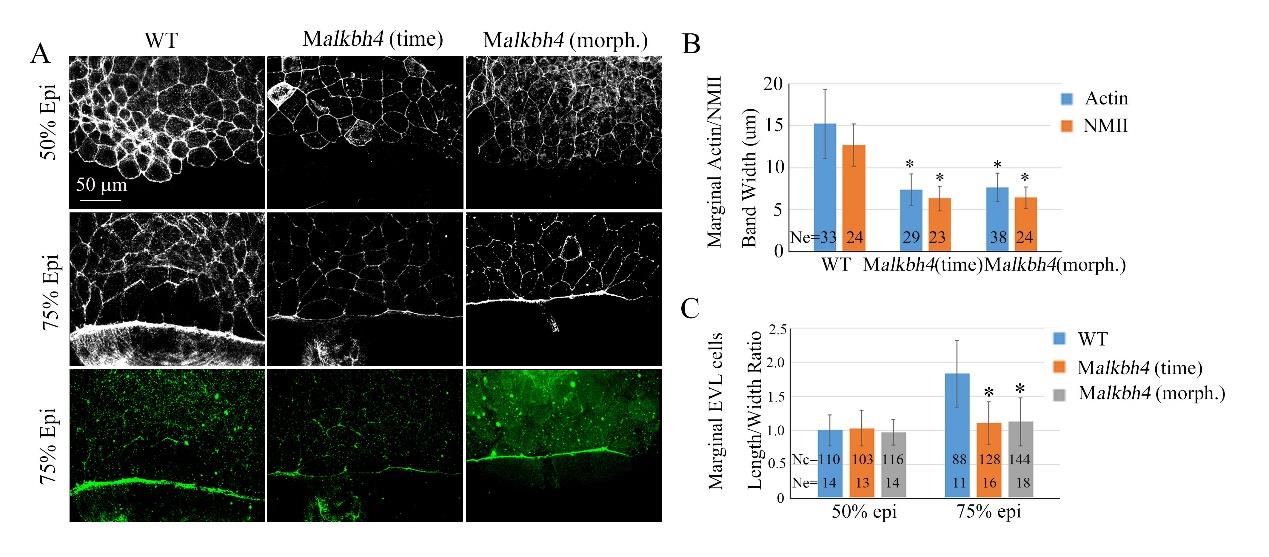
Actomyosin band formation in the E-YSL and marginal EVL cells morphology are affected in Malkbh4 embryos. (A) phalloidin and anti-NMII co-staining showing the defects of actomyosin band formation and marginal EVL cells morphology in Malkbh4 embryos. (B) Quantitative measurements of actomyosin band widths in (A) at 75% epiboly stage. (C) Quantitative measurements of the marginal EVL cell length/width ratios in (A) at both 50% and 75% epiboly. Ne, the number of observed embryos; Nc, the number of observed cells. *, p<0.01. Scale bar: 50 µm in (A).
Acknowledgments
This image is the copyrighted work of the attributed author or publisher, and
ZFIN has permission only to display this image to its users.
Additional permissions should be obtained from the applicable author or publisher of the image.
Full text @ Int. J. Biol. Sci.

