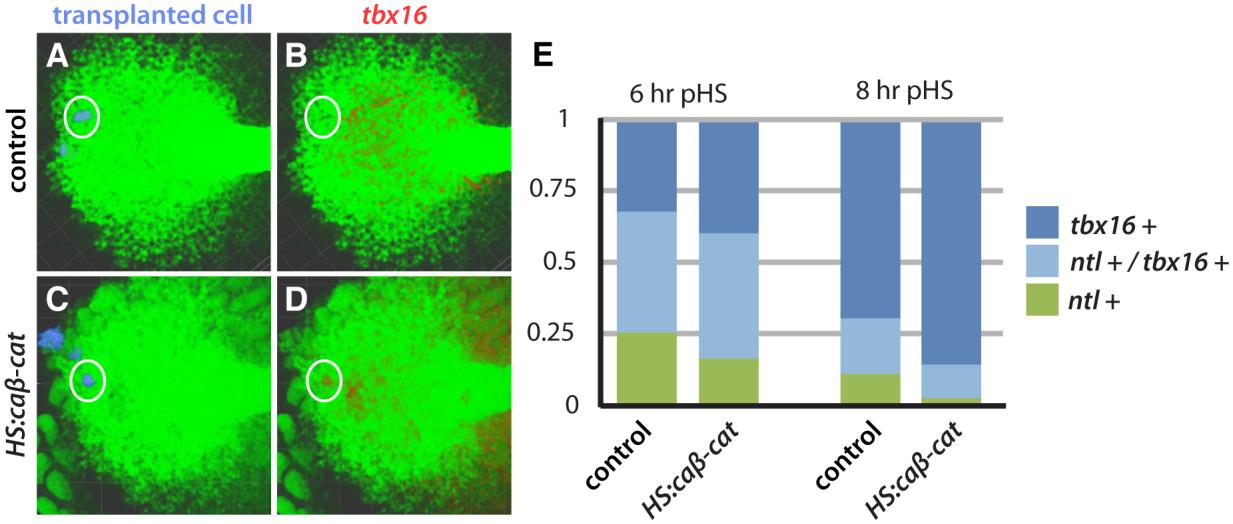
Fig. S7
Transplanted HS:caβ-catenin cells activate tbx16 cell-autonomously. (A, C) Transplanted cells in the progenitor population are identified in blue. Cell-autonomous expression of tbx16 is not apparent in control cells (B) but is apparent in cells with HS:caβ-catenin (D). (E) Quantification of all transplanted cells within the tailbud from the same experiment as shown in A-D. At both 6 and 8 hrs post-heat shock, cells expressing caβ-catenin were less likely to express ntl and more likely to express tbx16 than control transplanted cells. At 6 hours post-heat shock, 151 cells were analyzed from 16 embryos (control) and 190 cells were scored from 19 embryos (HS:caβ-catenin); the distribution of control cells was different from HS:caβ-catenin cells (chi-square; P=0.052). At 8 hours post-heat shock, 131 cells were analyzed from 15 embryos (control) and 99 cells were scored from 14 embryos (HS:caβ-catenin); the distribution of control cells was significantly different from HS:caβ-catenin cells (chi-square; P<0.01).

