
|
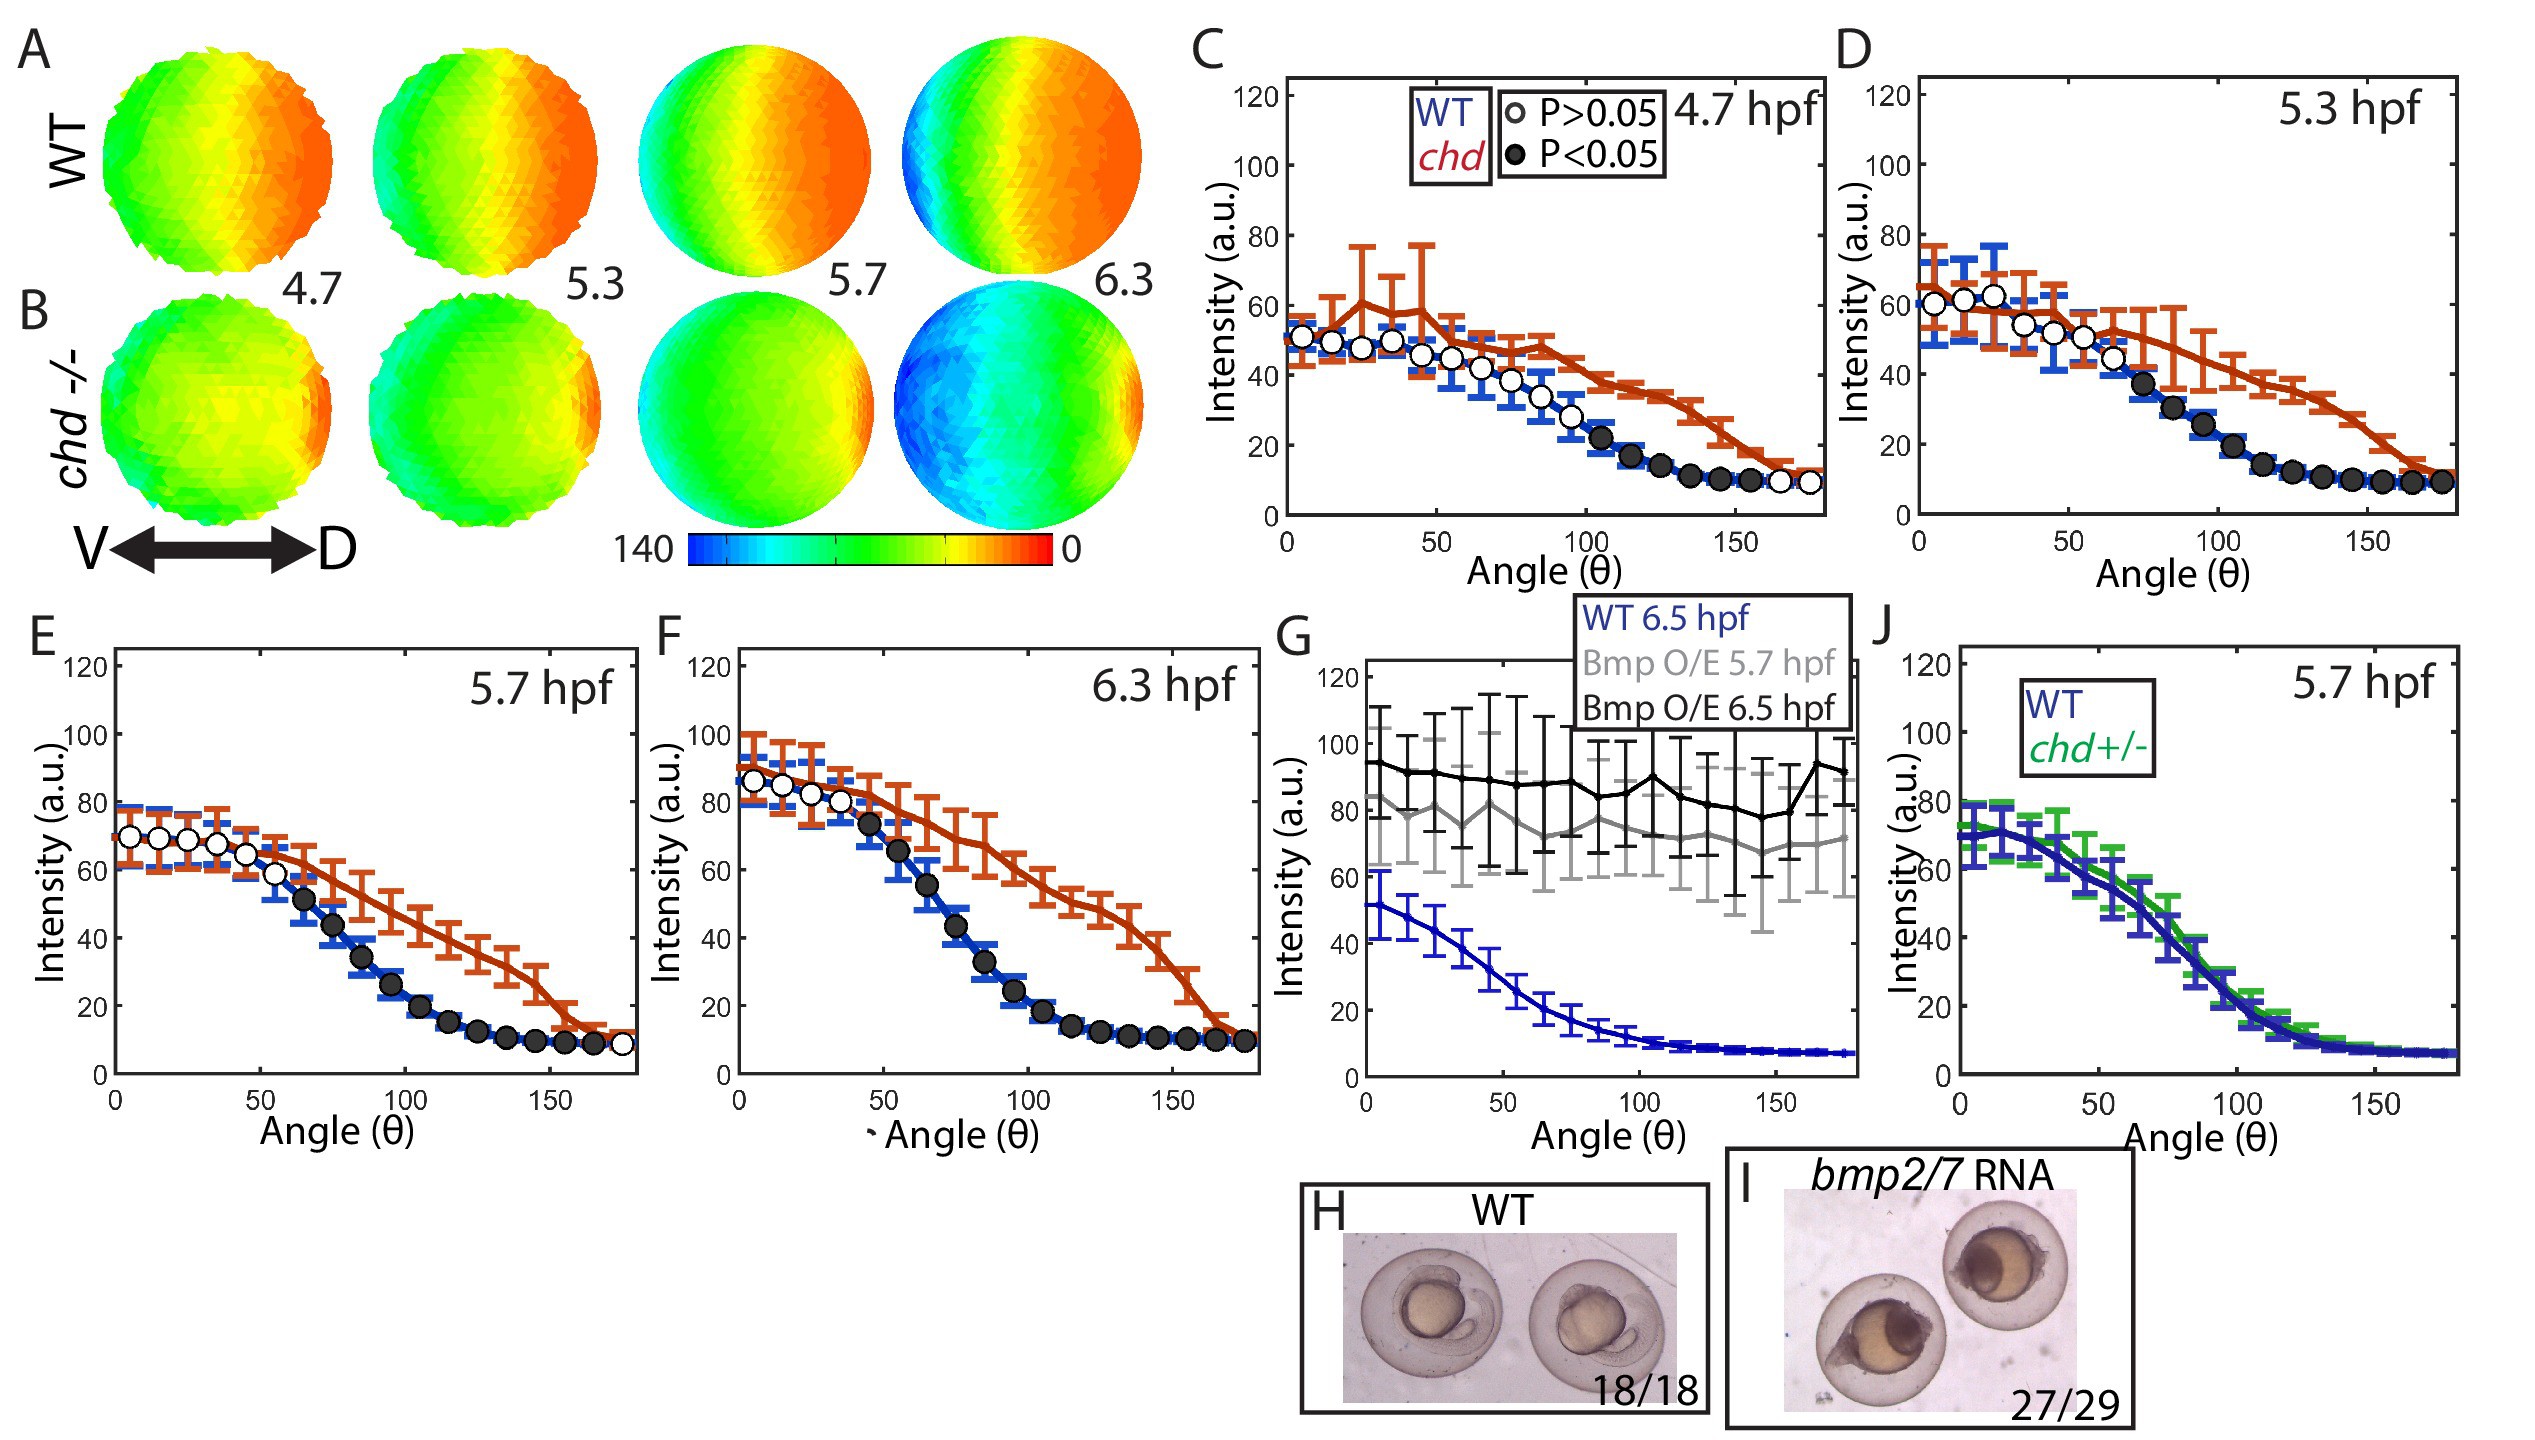
Fig. 6
Effect of Chd on gradient shape and ligand shuttling.
(A,B) Animal views of average intensities from each time-point in (A) WT (4.7: N = 3, 5.3: N = 4, 5.7: N = 13, 6.3: N = 11) and (B) chd mutant (4.7: N = 3, 5.3: N = 5, 5.7: N = 11, 6.3: N = 9) embryos. (C–F) Average marginal intensities for WT (blue) and chd mutant (red) embryos from 5.7 to 6.3 hpf. (G) Average marginal intensities for WT (blue, N = 4) and bmp2/7 RNA injected embryos at 5.7 (grey, N = 4) and 6.3 hpf (black, N = 5). Error bars indicate standard deviation. (H,I) Fully ventralized (V5) embryos injected with 6 pg of bmp7a RNA and 12 pg of bmp2b RNA vs uninjected WT siblings. (J) WT (N = 9) vs chd+/- (N = 10) at 5.7 hpf.