
|
Fig. 2
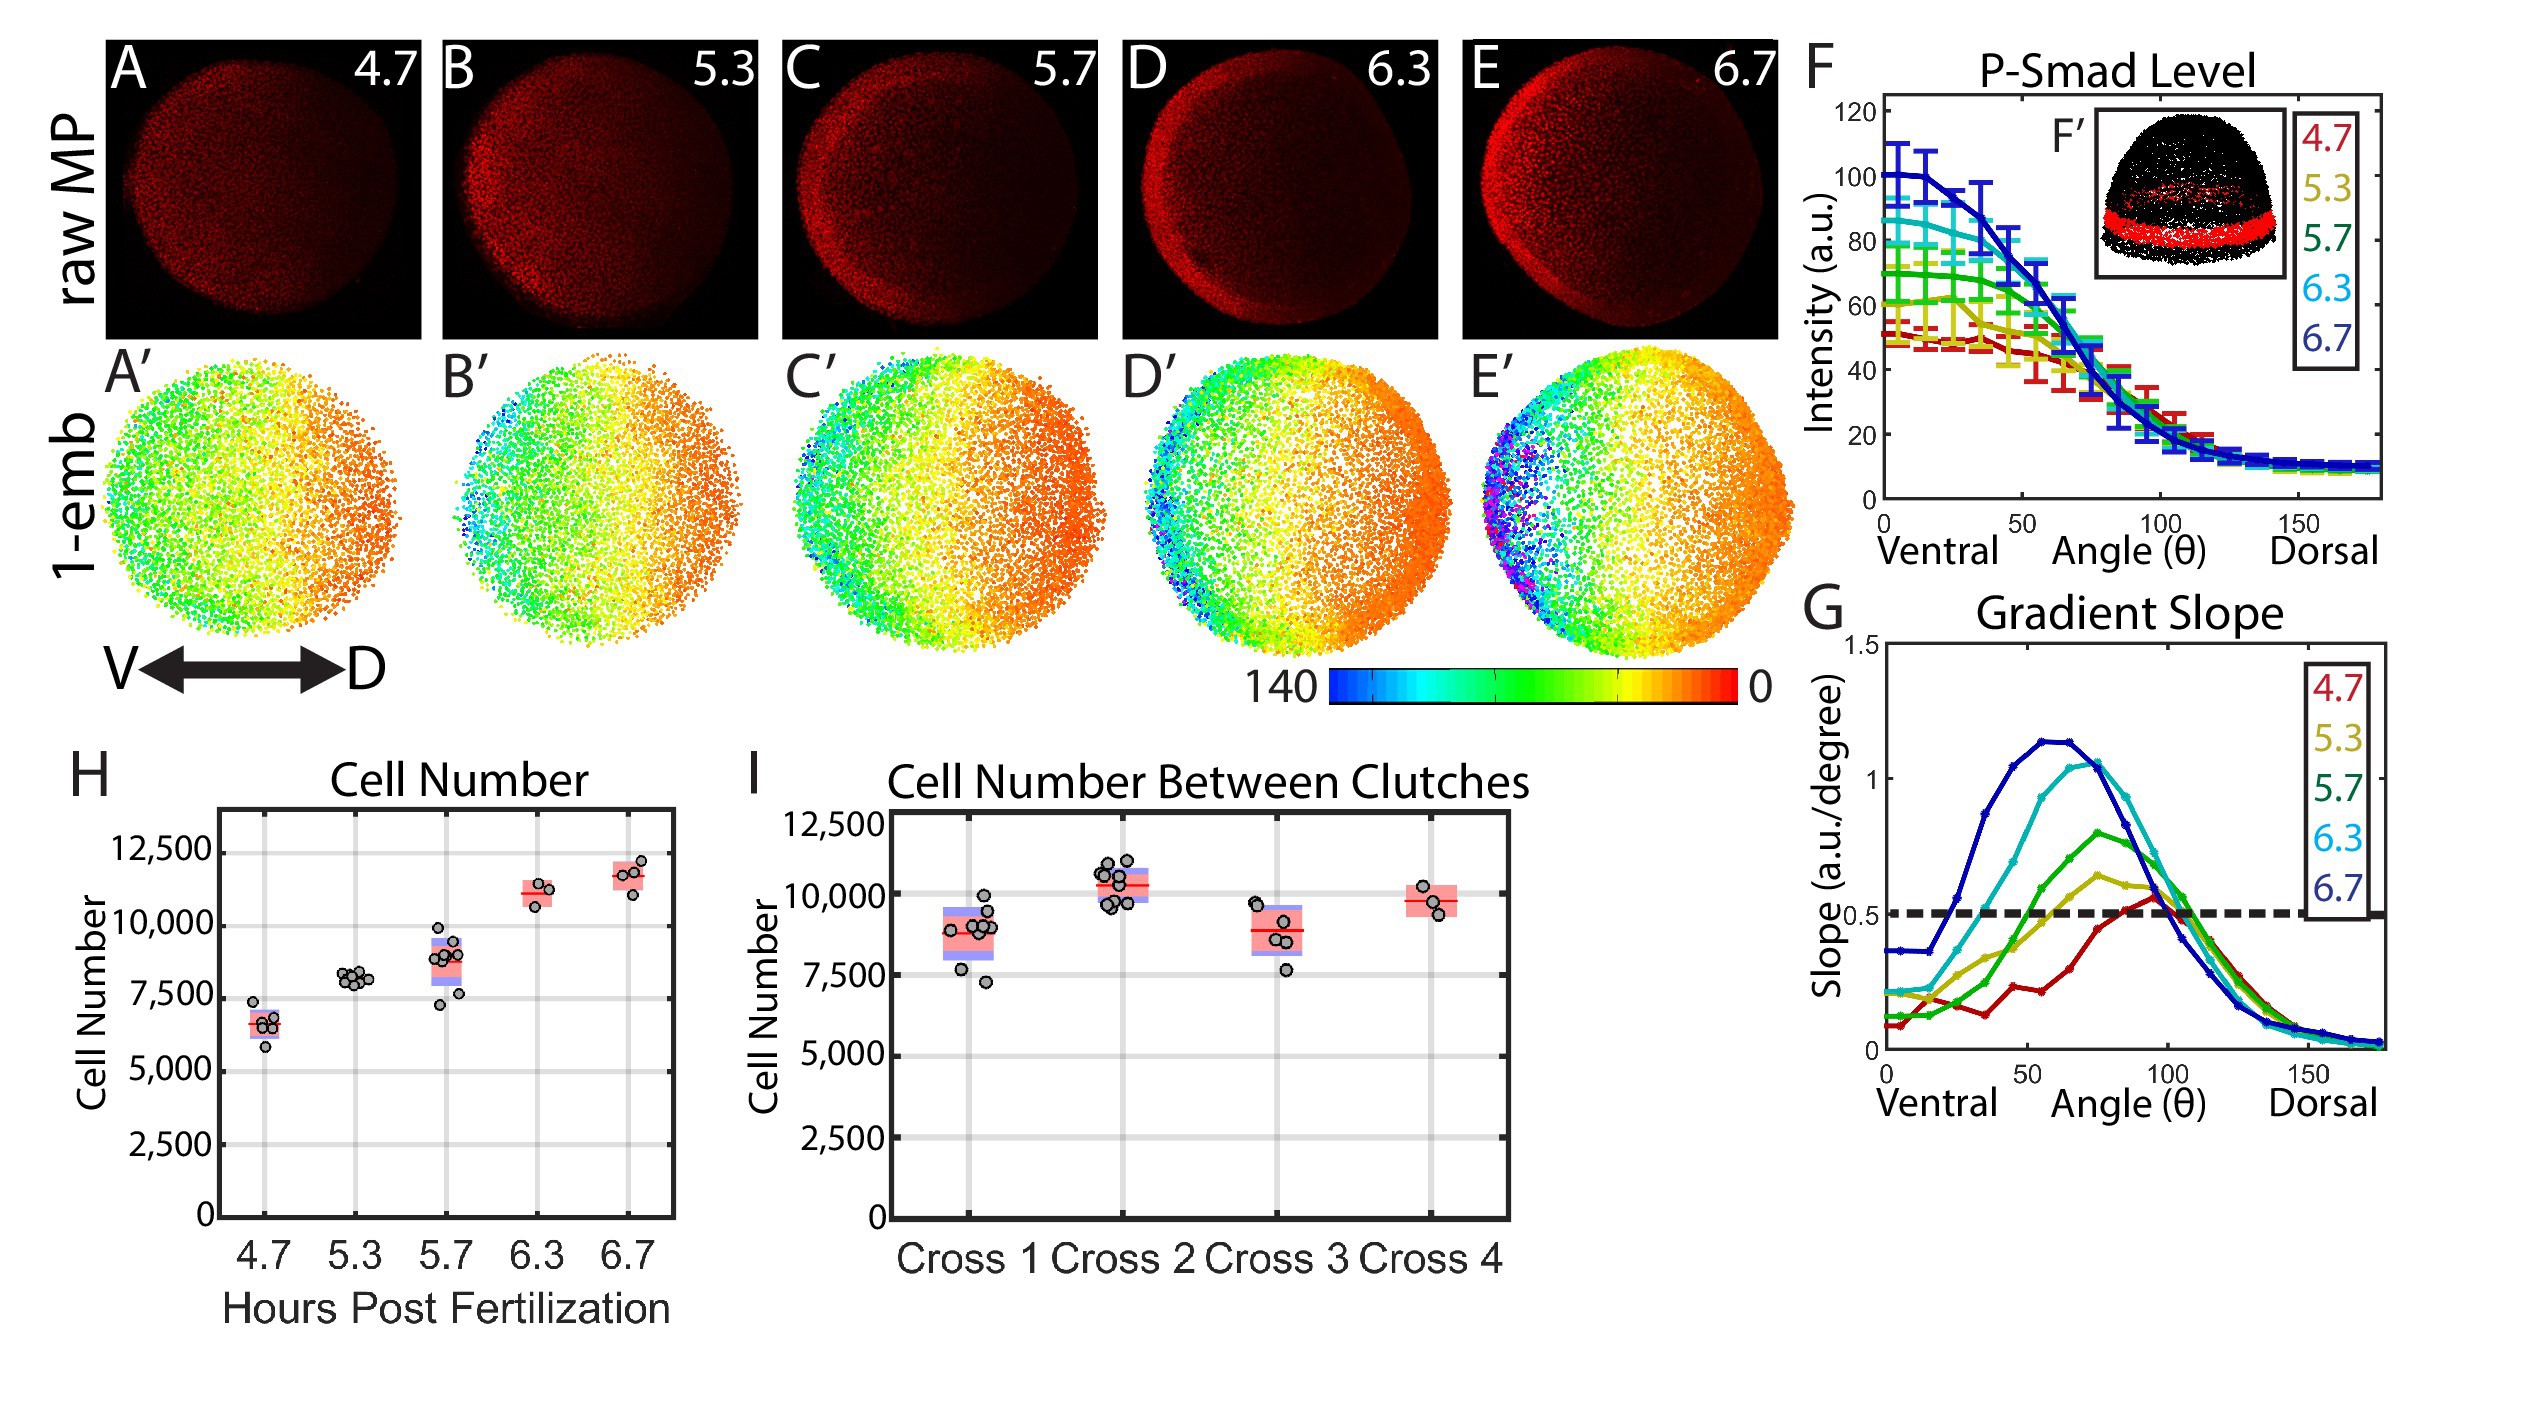
Dynamics of the WT P-Smad5 gradient across head and trunk patterning.
(A–E) Animal views of maximum projections (MP) of P-Smad5 stained individual embryos. (A’–E’) Animal views of nuclear intensities of all nuclei from the embryos shown above. (F) Average marginal intensities for 4.7–6.7 hpf (4.7: N = 3, 5.3: N = 4, 5.7: N = 13, 6.3: N = 11, 6.7: N = 4). Error bars indicate standard deviation. (G) Slope of the P-Smad5 gradients shown in panel F. Dotted line separates high slope (>0.5 a.u./deg) regions from low slope regions. (H) Change in cell number versus (vs.) developmental time of embryos fixed from a single cross and nuclei stained with Sytox Orange. (I) Cell number varies between different crosses of WT fish fixed at 5.7 hpf. (H,I) Gray dots are individual embryo cell counts. Red lines show the mean number of cells at a given time point, red boxes show 95% confidence interval, blue boxes show one standard deviation.