
|
Fig. S3
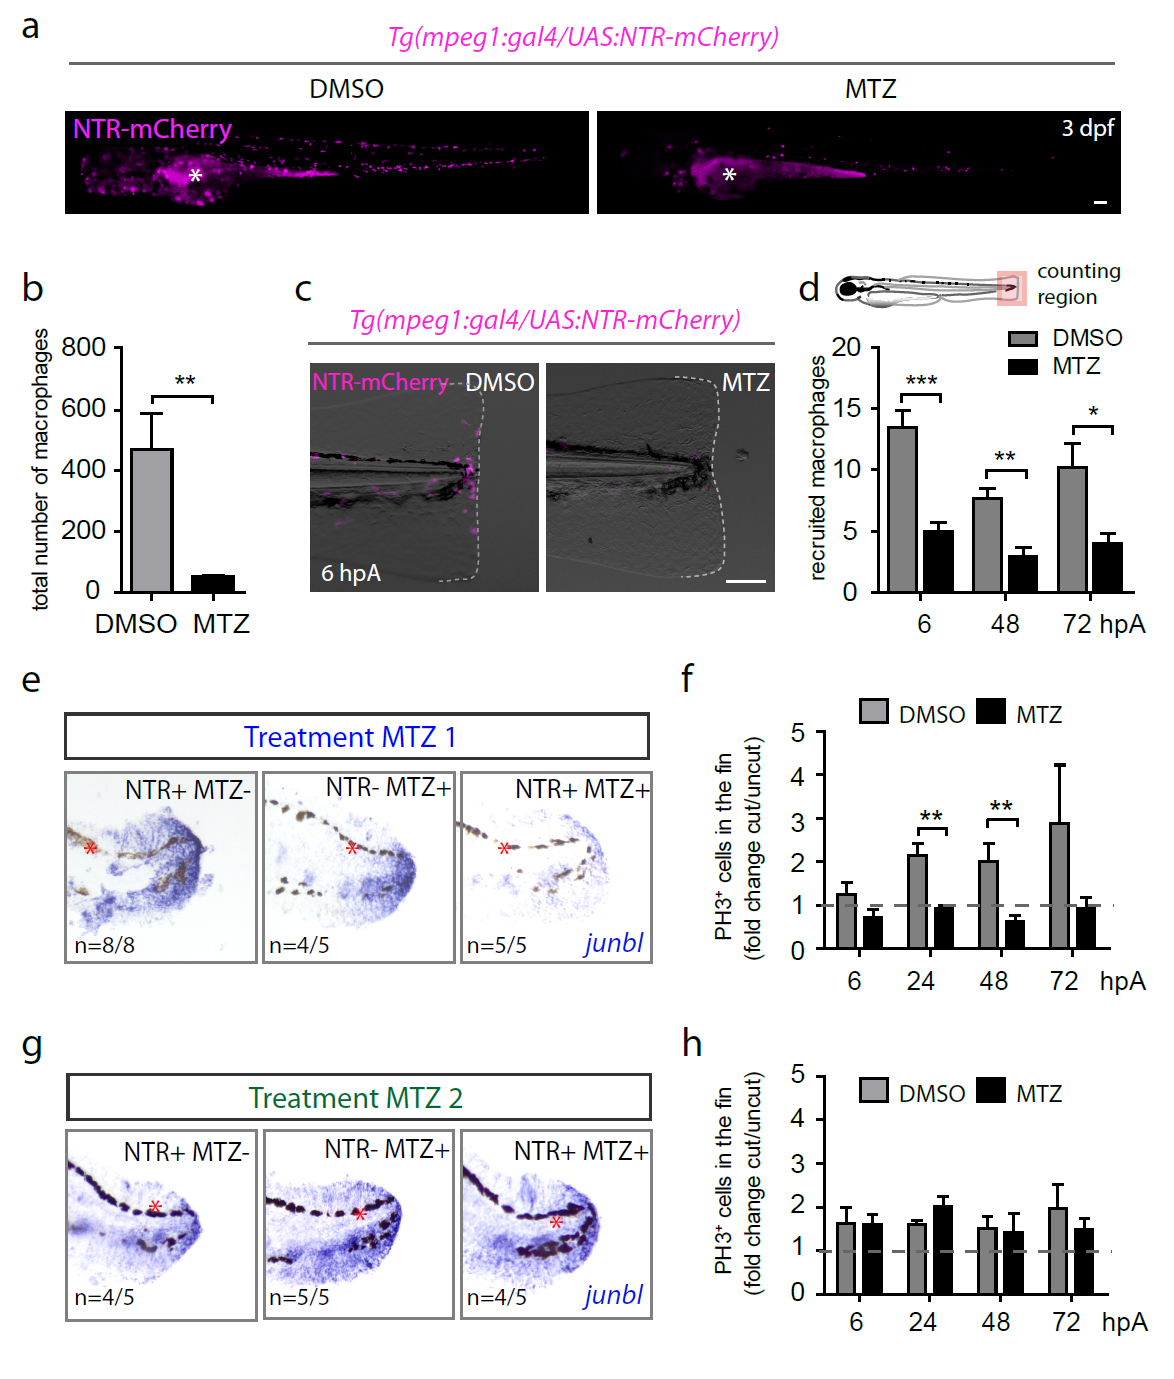
Metronidazol treatments on Tg(mpeg1:GAL4/UAS:NTRmCherry) larvae efficiently ablate macrophages and impair blastema formation in early stages of regeneration. (a) Tg(mpeg1:GAL4/UAS:NTR-mCherry) larvae were treated with either Metronidazol (MTZ) or DMSO at 48 hpf. NTR-mCherry fluorescence (magenta) was analyzed by microscopy 24 hours later (3dpf). Asterisks show the auto-fluorescence of the yolk sac and extension. (b) Corresponding counts of total macrophages in indicated conditions (mean � s.e.m, Nlarvae=5-6, **p<0.005). (c) Tg(mpeg1:GAL4/UAS:NTR-mCherry) larvae were treated with either MTZ or DMSO at 48 hpf and amputated at 3 dpf. Fin images are representative overlay of NTR-mCherry fluorescence (magenta) with transmitted light acquired by microscopy at 6 hpA. Dotted lines outline the fin. (a, c) Scale bars = 100 ?m. (d) Corresponding counts of recruited macrophages in the caudal fin region in indicated conditions (mean number of cells � s.e.m (Nlarvae=6-12 per group, ***p<0.001, **p<0.005 and *p<0.05). (e and g) junbl mRNA expression (blue) at 24 hpA, as shown by in situ hybridization in (NTR+ MTZ-), (NTR- MTZ+) and (NTR+ MTZ+) larvae. Tg(mpeg1:GAL4/UAS:NTR-mCherry) larvae were treated with MTZ (NTR+ MTZ+). DMSO treatments on the same line (NTR+ MTZ-) or MTZ treatments on WT siblings (NTR- MTZ+) were used as controls. Larvae were treated with DMSO or MTZ either 24 hours before amputation (Treatment MTZ 1, e) or at 6 hpA (Treatment MTZ 2, g), red asterisks show pigments (black). (f and h) Blastema cell proliferation at 6, 24, 48 and 72 hpA after MTZ 1 (f) and MTZ 2 (h) treatments in indicated conditions using an anti-PH3 antibody (Nlarvae = 5-7 per group, mean values � s.e.m, **p<0.01).