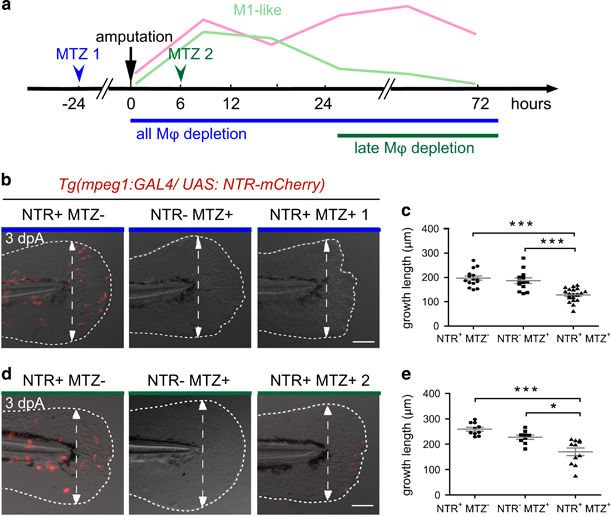
Fig. 3
Genetic depletion of macrophages at different stages confirms the requirement of macrophages during fin regeneration. (a) Schedule of macrophage (M?) depletion using Tg(mpeg1:GAL4/UAS:NTR-mCherry) larvae and Metronidazol (MTZ) treatment. (b?e) Tg(mpeg1:GAL4/UAS:NTR-mCherry) larvae were treated with MTZ (NTR+ MTZ+) to deplete macrophages. DMSO treatments on the same line (NTR+ MTZ?) or MTZ treatments on WT siblings (NTR? MTZ+) were used as controls. (b) Treatments were performed from 48?hpf and fins were amputated at 3?dpf to deplete macrophages during the whole regeneration process (MTZ 1). (d) Treatments were performed from 6?hpA to deplete late macrophages (MTZ 2). Fin images are representative overlays of mCherry-F fluorescence (red) with transmitted light acquisitions at 3?dpA. Scale bar=100??m. Dotted lines outline the fin; dashed arrows indicate the position of the initial amputation. (c and e) Corresponding quantification of the regenerated fin length at 3?dpA in MTZ 1 (c) and MTZ 2 treatments (e) in indicated conditions (meanąS.E.M. from three independent experiments, ***P<0.001 and *P<0.05)

