
|
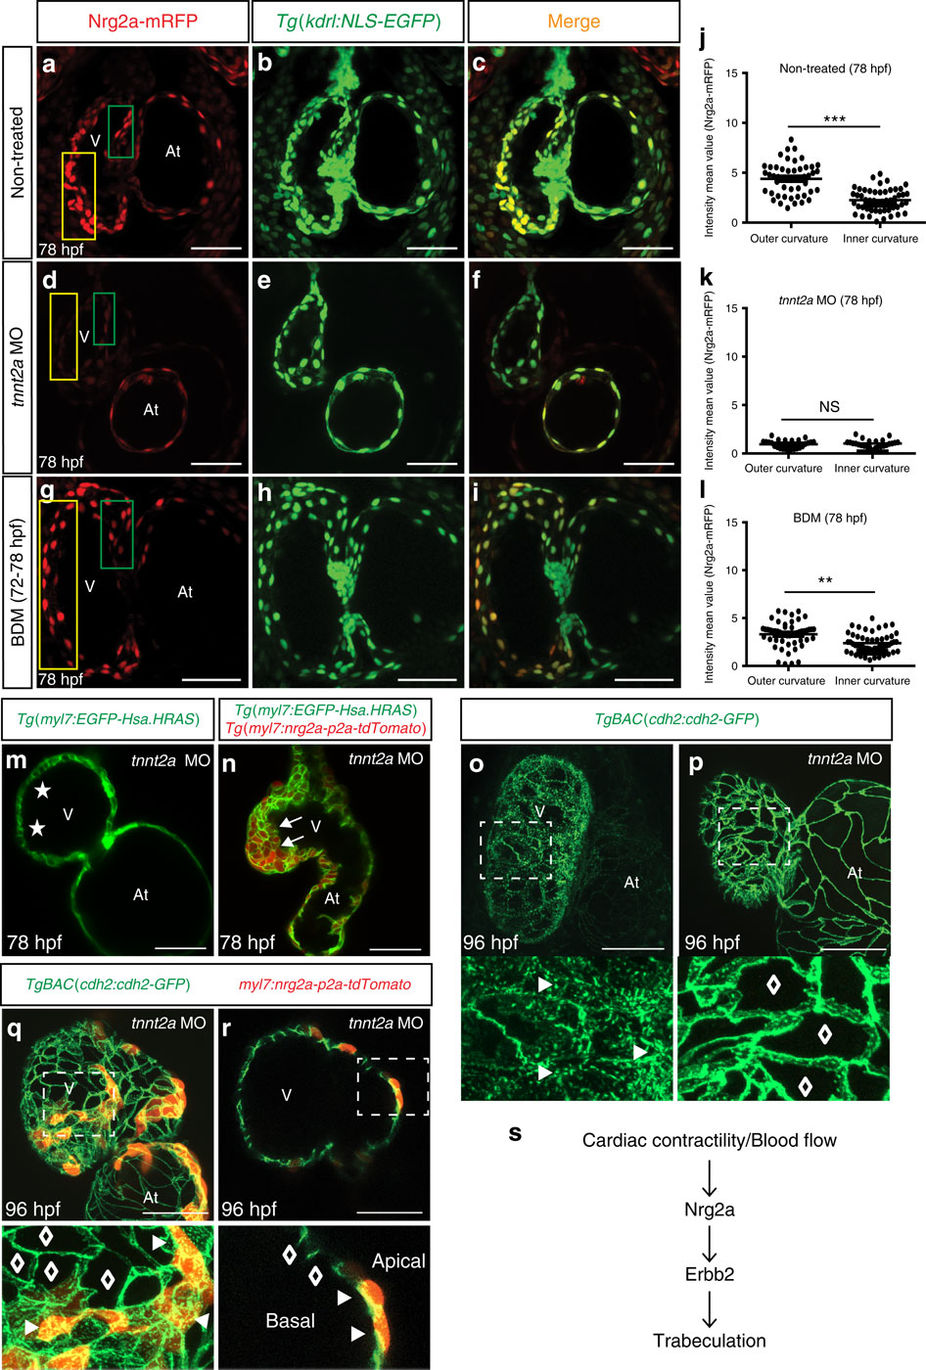
Fig. 6
Contractility/blood flow is required for endocardial expression of nrg2a but not the ability of cardiomyocytes to respond to nrg2a.
(a?i) Maximum intensity z-projections (25?30 z-stacks, mid-sagittal sections) of Tg(kdrl:NLS-EGFP);nrg2a+/? hearts from non-treated (a?c), tnnt2a MO injected (d?f) and BDM treated (g?i) 78?hpf larvae; scale bars, 50??m. (j?l) Graphs showing cell-based Nrg2a-mRFP intensity in outer curvature (yellow box) and inner curvature (green box) of hearts from non-treated (j), tnnt2a MO (k) and BDM treated (l) 78?hpf larvae; dots represent individual Nrg2a-mRFP expressing endocardial cells. Values represent means�s.e.m.; **P?0.01, ***P?0.001, NS (not significant), by Student?s t-test. (m,n) 2D confocal images (mid-sagittal sections) of 78 hpf Tg(myl7:EGFP-Hsa.HRAS) (m) or Tg(myl7:EGFP-Hsa.HRAS);Tg(myl7:nrg2a-p2a-tdTomato) hearts (n) showing that myocardial overexpression of nrg2a can induce cardiomyocyte multilayering in tnnt2a morphants; asterisks and arrows indicate single-layered and multilayered ventricular walls, respectively. (o?r) Maximum intensity z-projections of TgBAC(cdh2:cdh2-EGFP) hearts from non-injected (o), injected with tnnt2a MO alone (p) or injected with tnnt2a MO and myl7:nrg2a-p2a-tdTomato plasmid (q,r) 96?hpf larvae. (r) 2D confocal image (sagittal section) of heart shown in q. Magnified images of dashed boxes are shown below (o?r); arrowheads and lozenges indicate presence and absence of Cdh2-EGFP proteins on the basal side of cardiomyocytes, respectively; At: atrium; V, ventricle; scale bars, 50??m. (s) Schematic diagram of modulation of Nrg2a/Erbb2 signaling by cardiac contractility/blood flow.