Fig. 3
TGF-? Signaling Is Required for the PAA Progenitor to Angioblast Transition
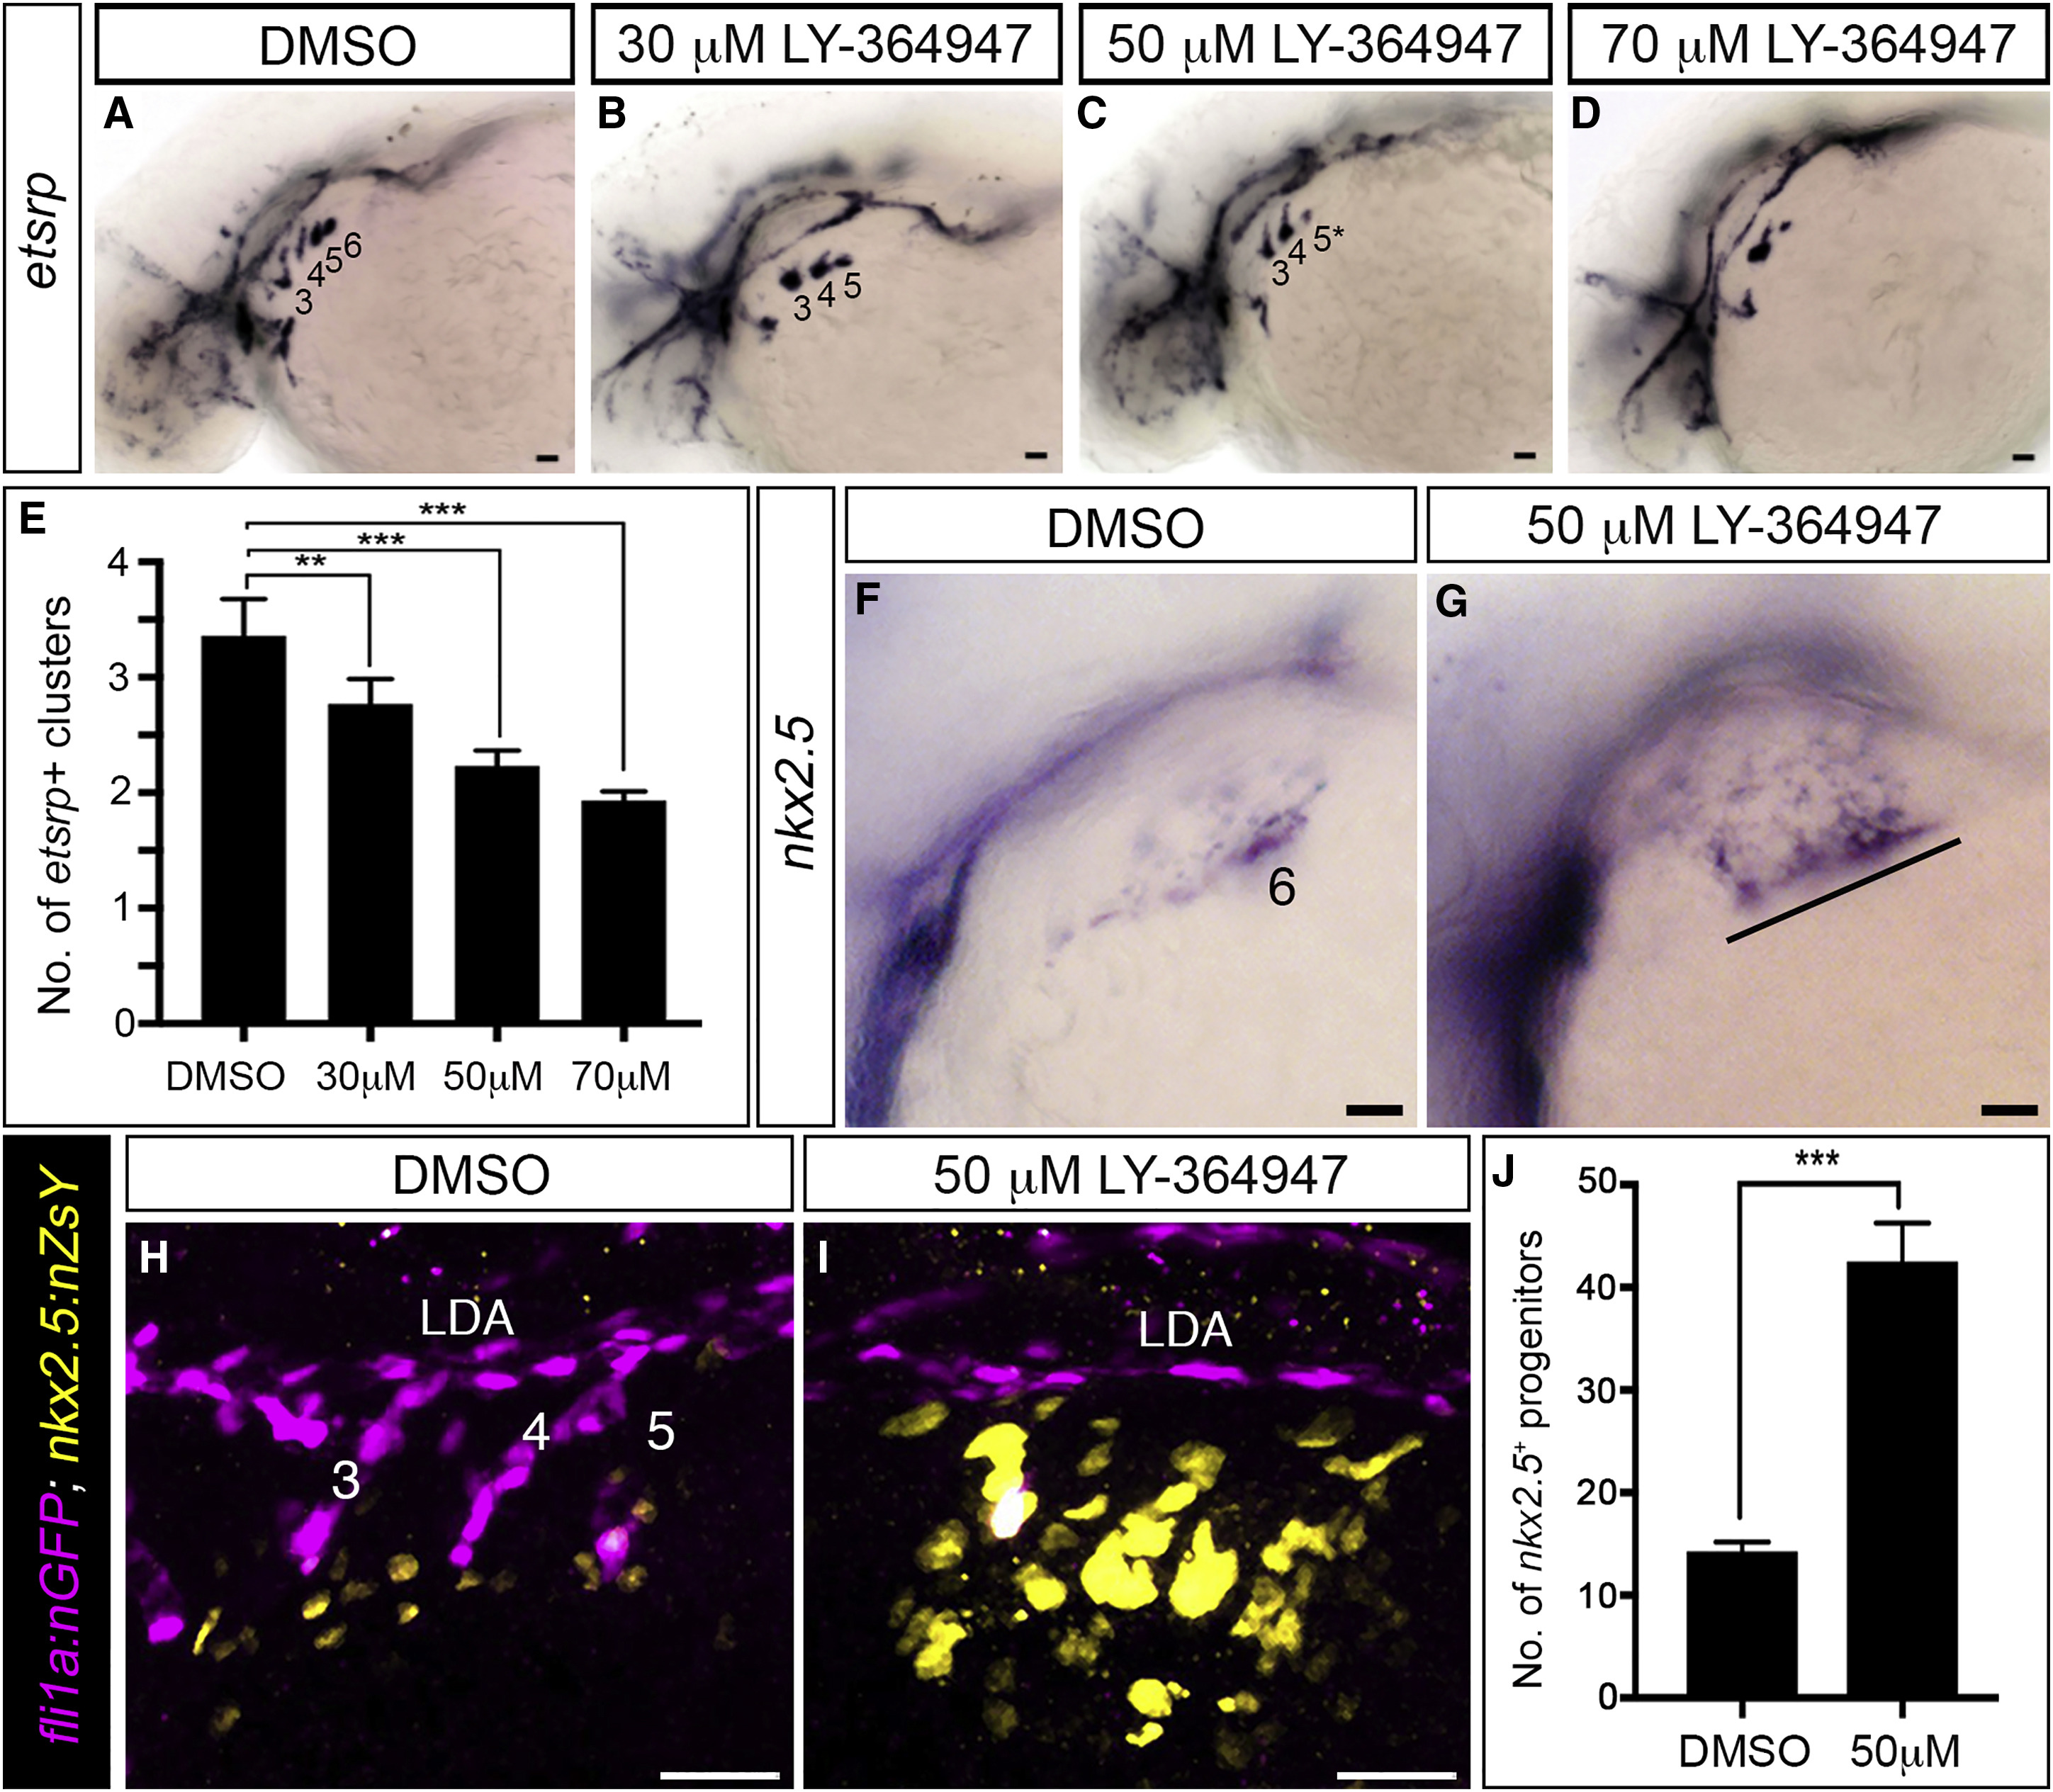
(A?D) Left lateral views of etsrp+ PAA angioblasts in 36-hpf embryos treated from 20-hpf stage with DMSO or the indicated, increasing concentrations of LY-364947. The angioblast clusters that did form in LY-364947-treated embryos were smaller and/or failed to sprout (asterisks in C and D). Scale bars, 200 ?m.
(E) Bar graph showing the average number of etsrp+ angioblast clusters ąSD within each experimental group (??p < 0.01; ???p < 0.001). n = 40?50 embryos per treatment group with a total of four biological replicates.
(F and G) Left lateral views of nkx2.5+ PAA progenitors in 36-hpf embryos treated from 20 hpf with DMSO (F, n = 43) or LY-364947 (G, n = 38/54 with the phenotype shown, 14/54 showed a milder phenotype, 2/54 appeared normal). The line in (G) highlights persistent expression of nkx2.5 transcripts in PAA progenitors of arches 3?6 in LY-364947-treated embryos.
(H and I) Left lateral views of 38-hpf Tg(fli1a:nGFP),Tg(nkx2.5:ZsYellow) embryos treated from 20 hpf with DMSO or LY-364947, immunostained for GFP and ZsYellow, and imaged in the green and red channels to visualize PAA endothelial (pseudocolored magenta) and progenitor (pseudocolored yellow) cell nuclei, respectively.
(J) The bar graph shows the average numbers ąSD of nkx2.5:ZsYellow+ PAA progenitors in DMSO and LY-364947-treated embryos. n = 4 for both experimental groups. ???p < 0.0001. Scale bars, 25 ?m.

