
|
Fig. 3
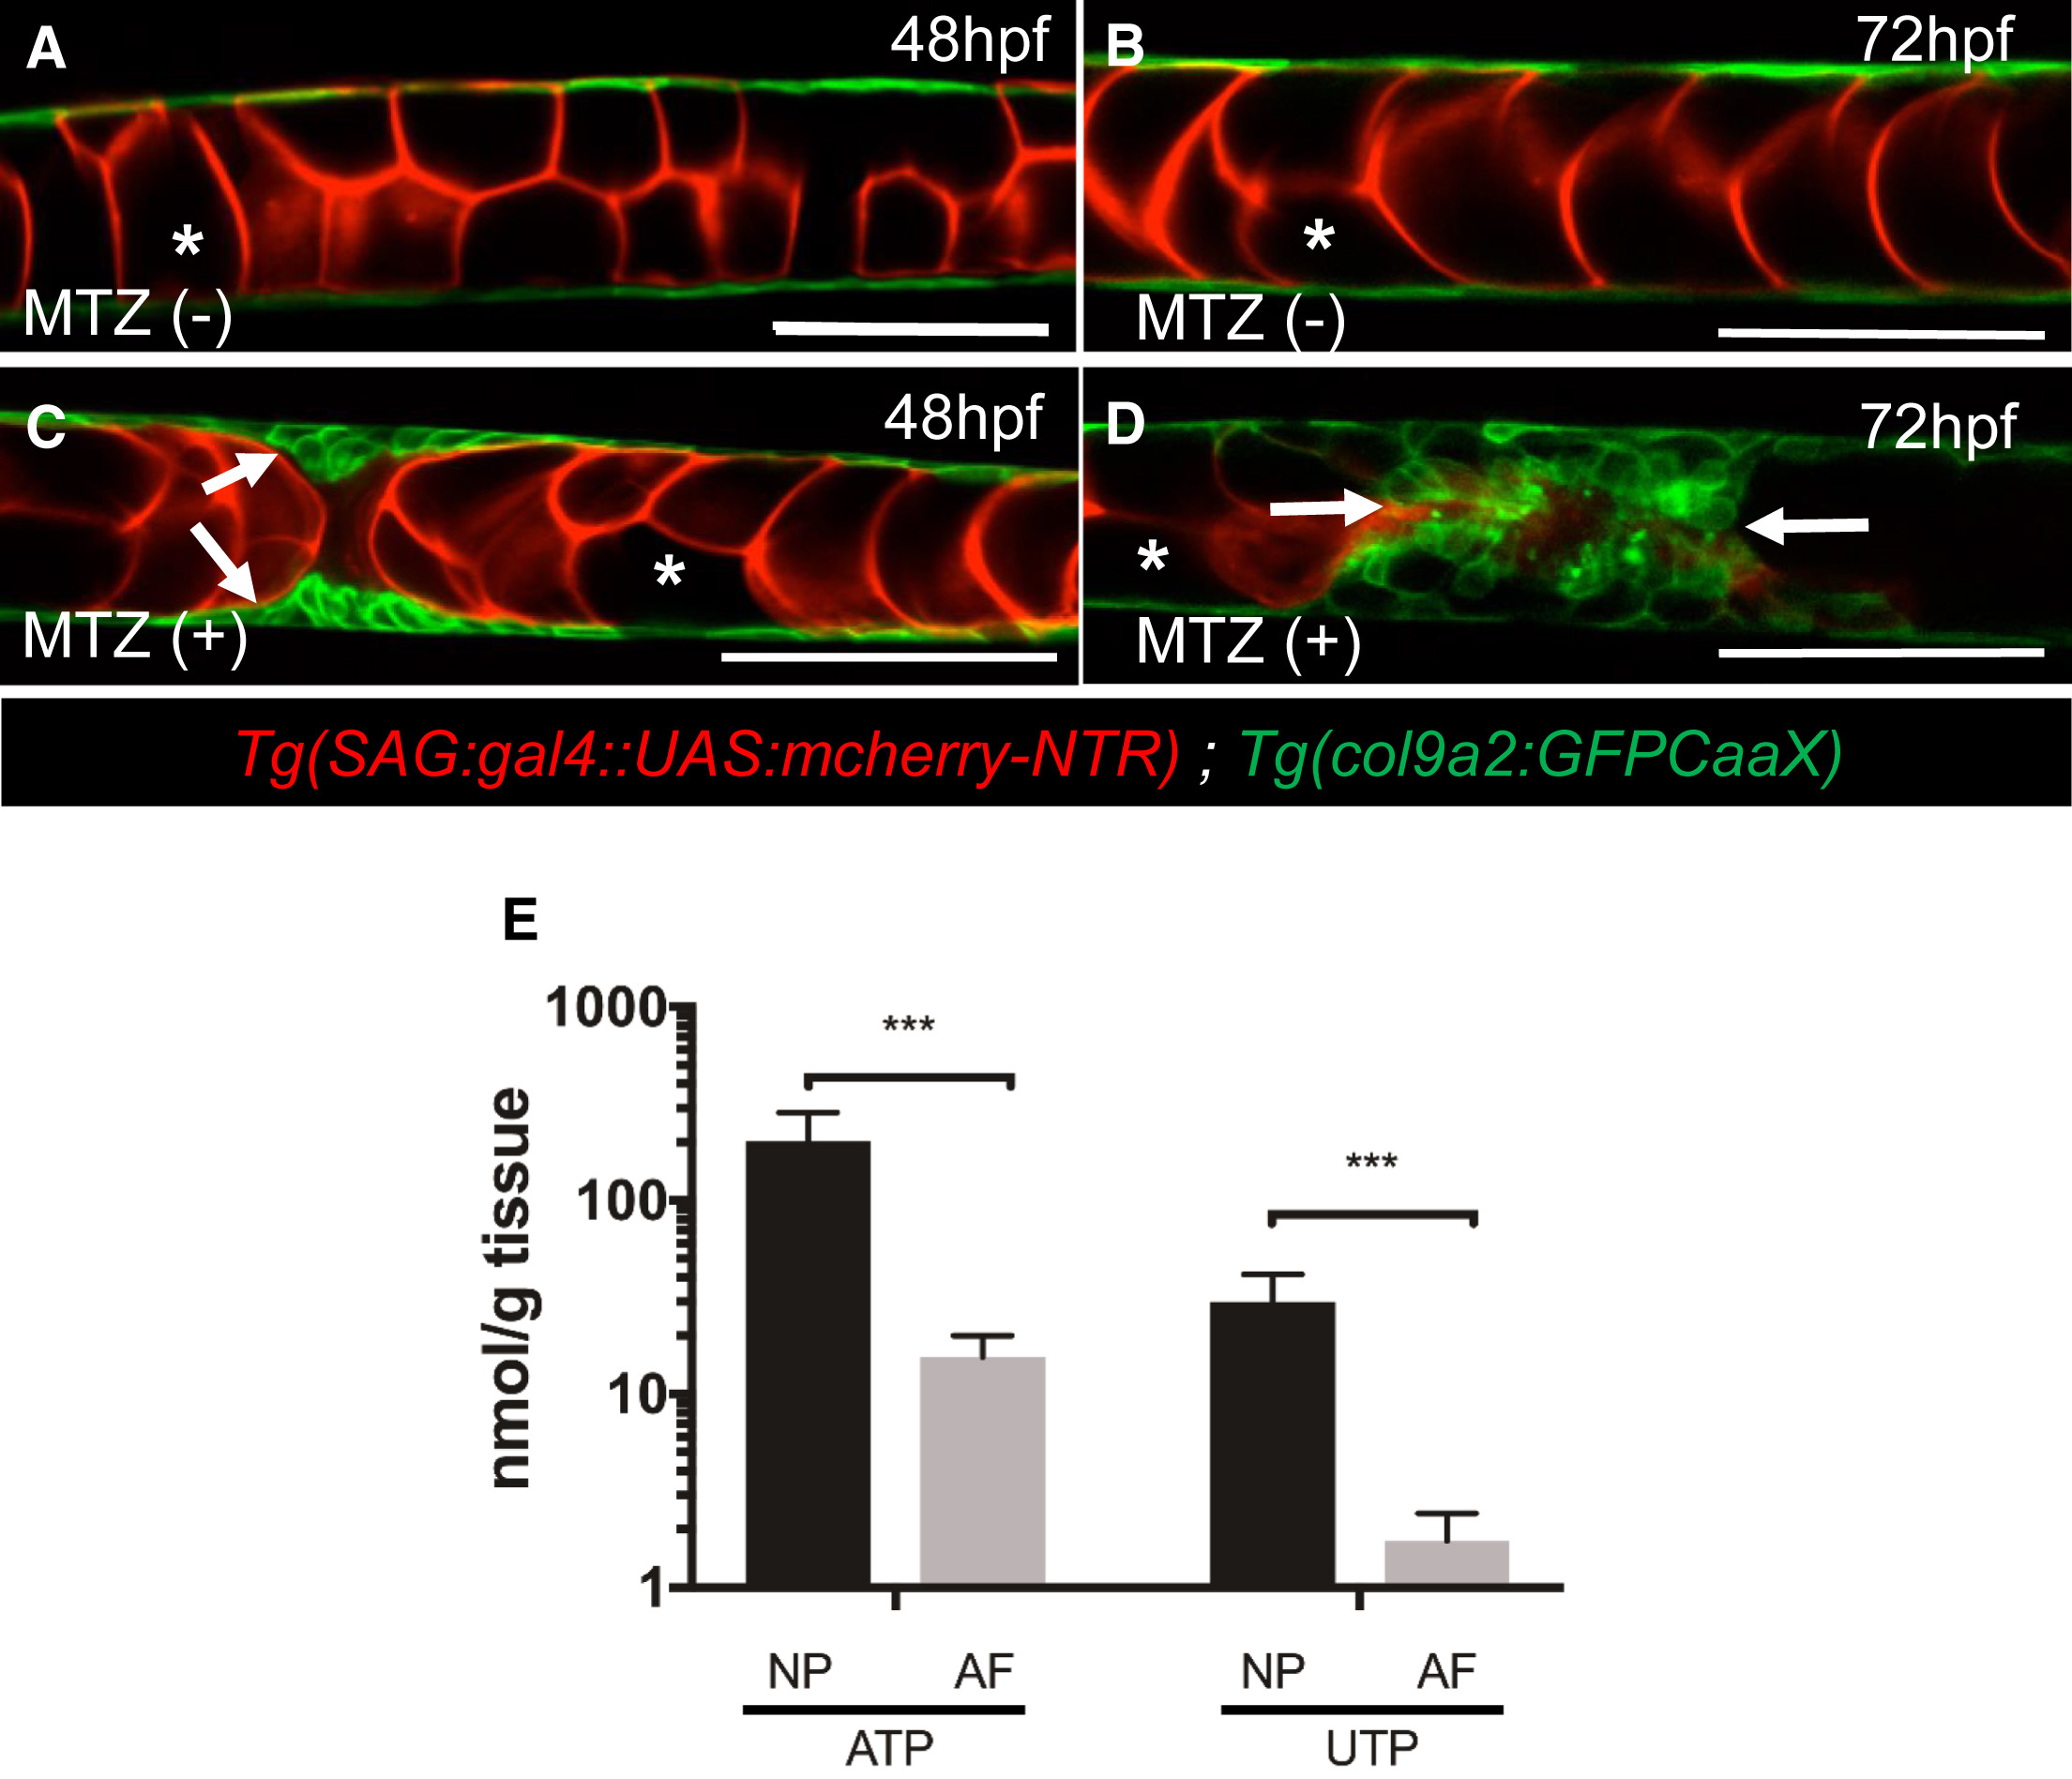
Release of Vacuolated Cell Contents Triggers Sheath Cell Invasion
(A and B) Confocal images of live WT embryos expressing sag:gal4::UAS:mcherry-NTR in vacuolated cells and col9a2:GFPCaaX in sheath cells.
(C and D) In embryos treated with 1.5 mM metronidazole (MTZ), sheath cells invade areas of vacuolated cell death. Arrows point to invading sheath cells; asterisks mark intact vacuolated cells.
(E) LC-MS quantitation of ATP and UTP levels in nucleus pulposus (NP) and annulus fibrosis (AF) tissue isolated from 6-month-old pig spines. n = 12 for NP and 4 for AF. ???p < 0.001, Student?s t test.
The scale bars represent 100 ?m. Error bars are SD. See also Figures S3 and S4.