
|
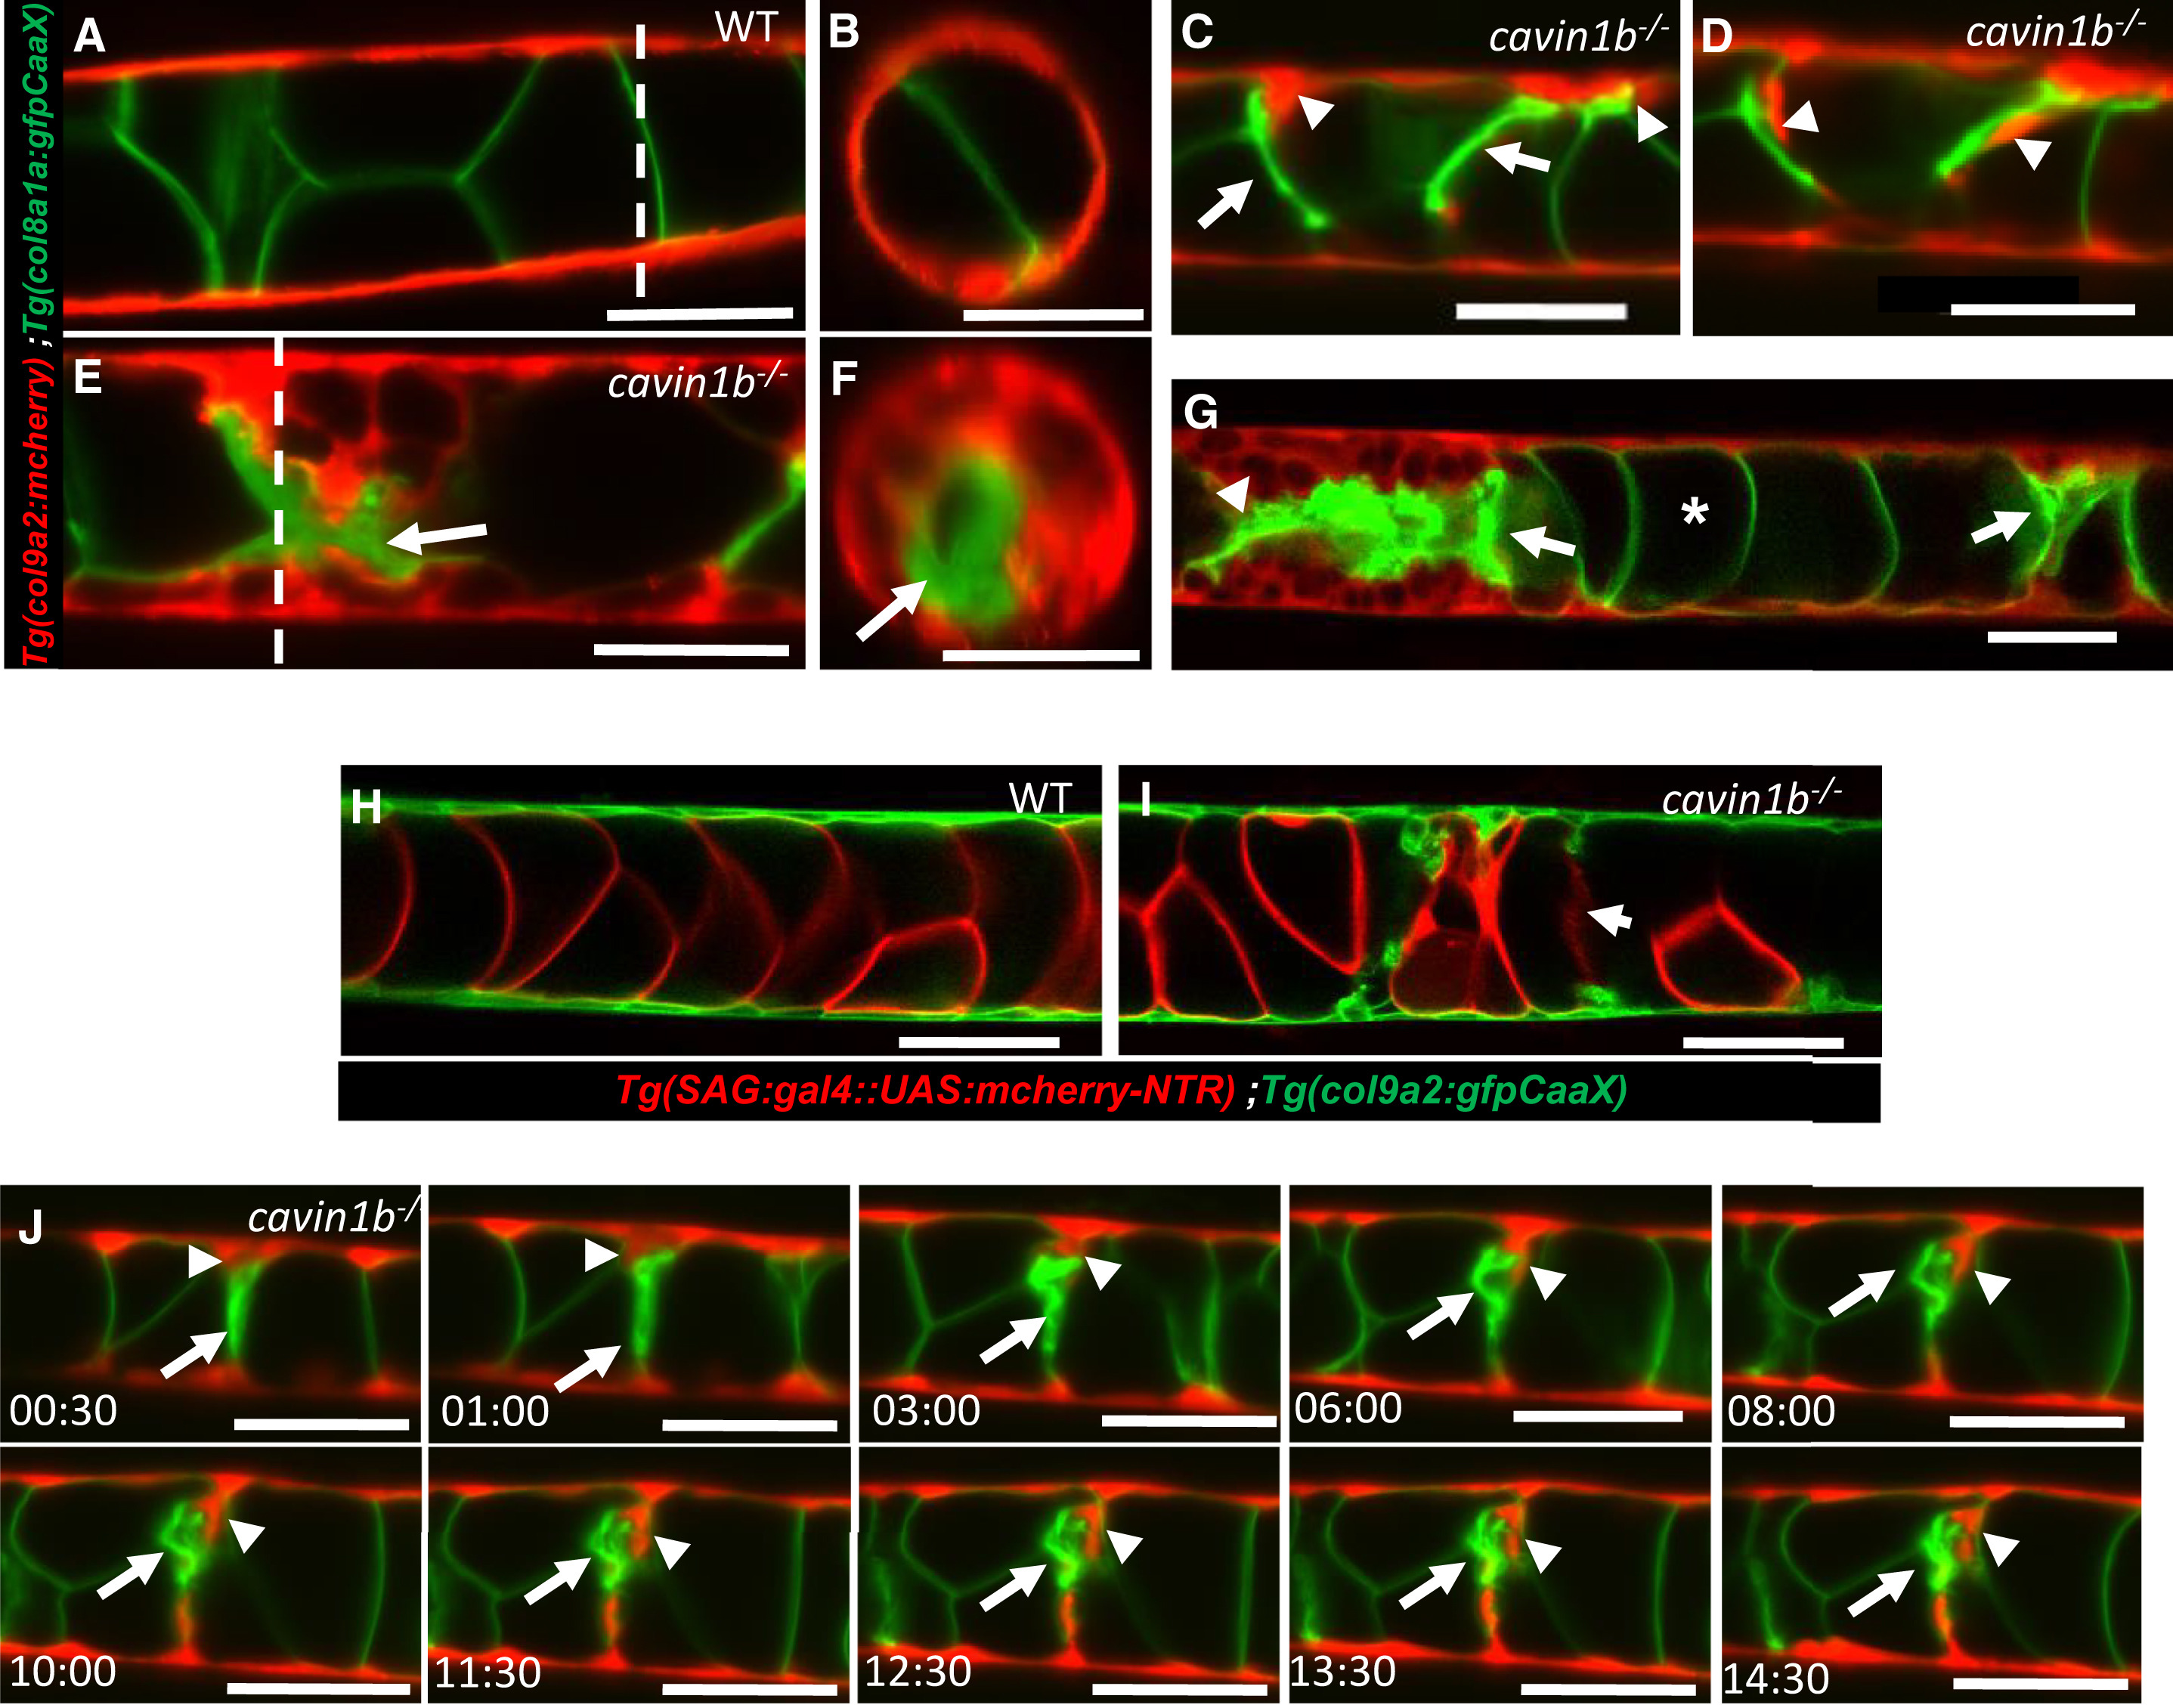
Fig. 2
Collapse of Vacuolated Cells Triggers Sheath Cell Invasion
(A and B) Lateral and orthogonal views of a live 72 hpf WT larva expressing col8a1a:GFPCaaX in vacuolated cells and col9a2:mcherry in sheath cells. The dashed lines in (A) mark the AP level in which the optical cross sections shown in (B) were taken.
(C and D) In cavin1b mutants with mild lesions, individual sheath cells wedge and invade the inner notochord where vacuolated cells have collapsed.
(E and F) Lateral and orthogonal views of a live 72 hpf cavin1b mutant with severe lesions showing multiple invading sheath cells. The dashed lines in (E) mark the AP level at which the optical cross sections shown in (F) were taken.
(G) Confocal image of a live 72 hpf cavin1b mutant with two notochord lesions in close proximity (arrows). The asterisk marks an intact vacuolated cell.
(H and I) Confocal images of a live 72 hpf WT and a cavin1b?/? mutant expressing sag:gal4::UAS:mcherry-NTR in vacuolated cells and col9a2:GFPCaaX in sheath cells. Collapsed vacuolated cells lose cytoplasmic contents.
(J) Still frames from a 15-hr LSM time-lapse movie showing sheath cells expressing col9a2:mcherry invading the inner notochord next to a collapsed vacuolated cell expressing col8a1a:GFPCaax.
Arrows point to a collapsed vacuolated cell; arrowheads indicate an invading sheath cell. Scale bars, 50 ?m. Error bars are SD. See also Figures S2?S4 and Movies S1 and S2.