Fig. 3 S2
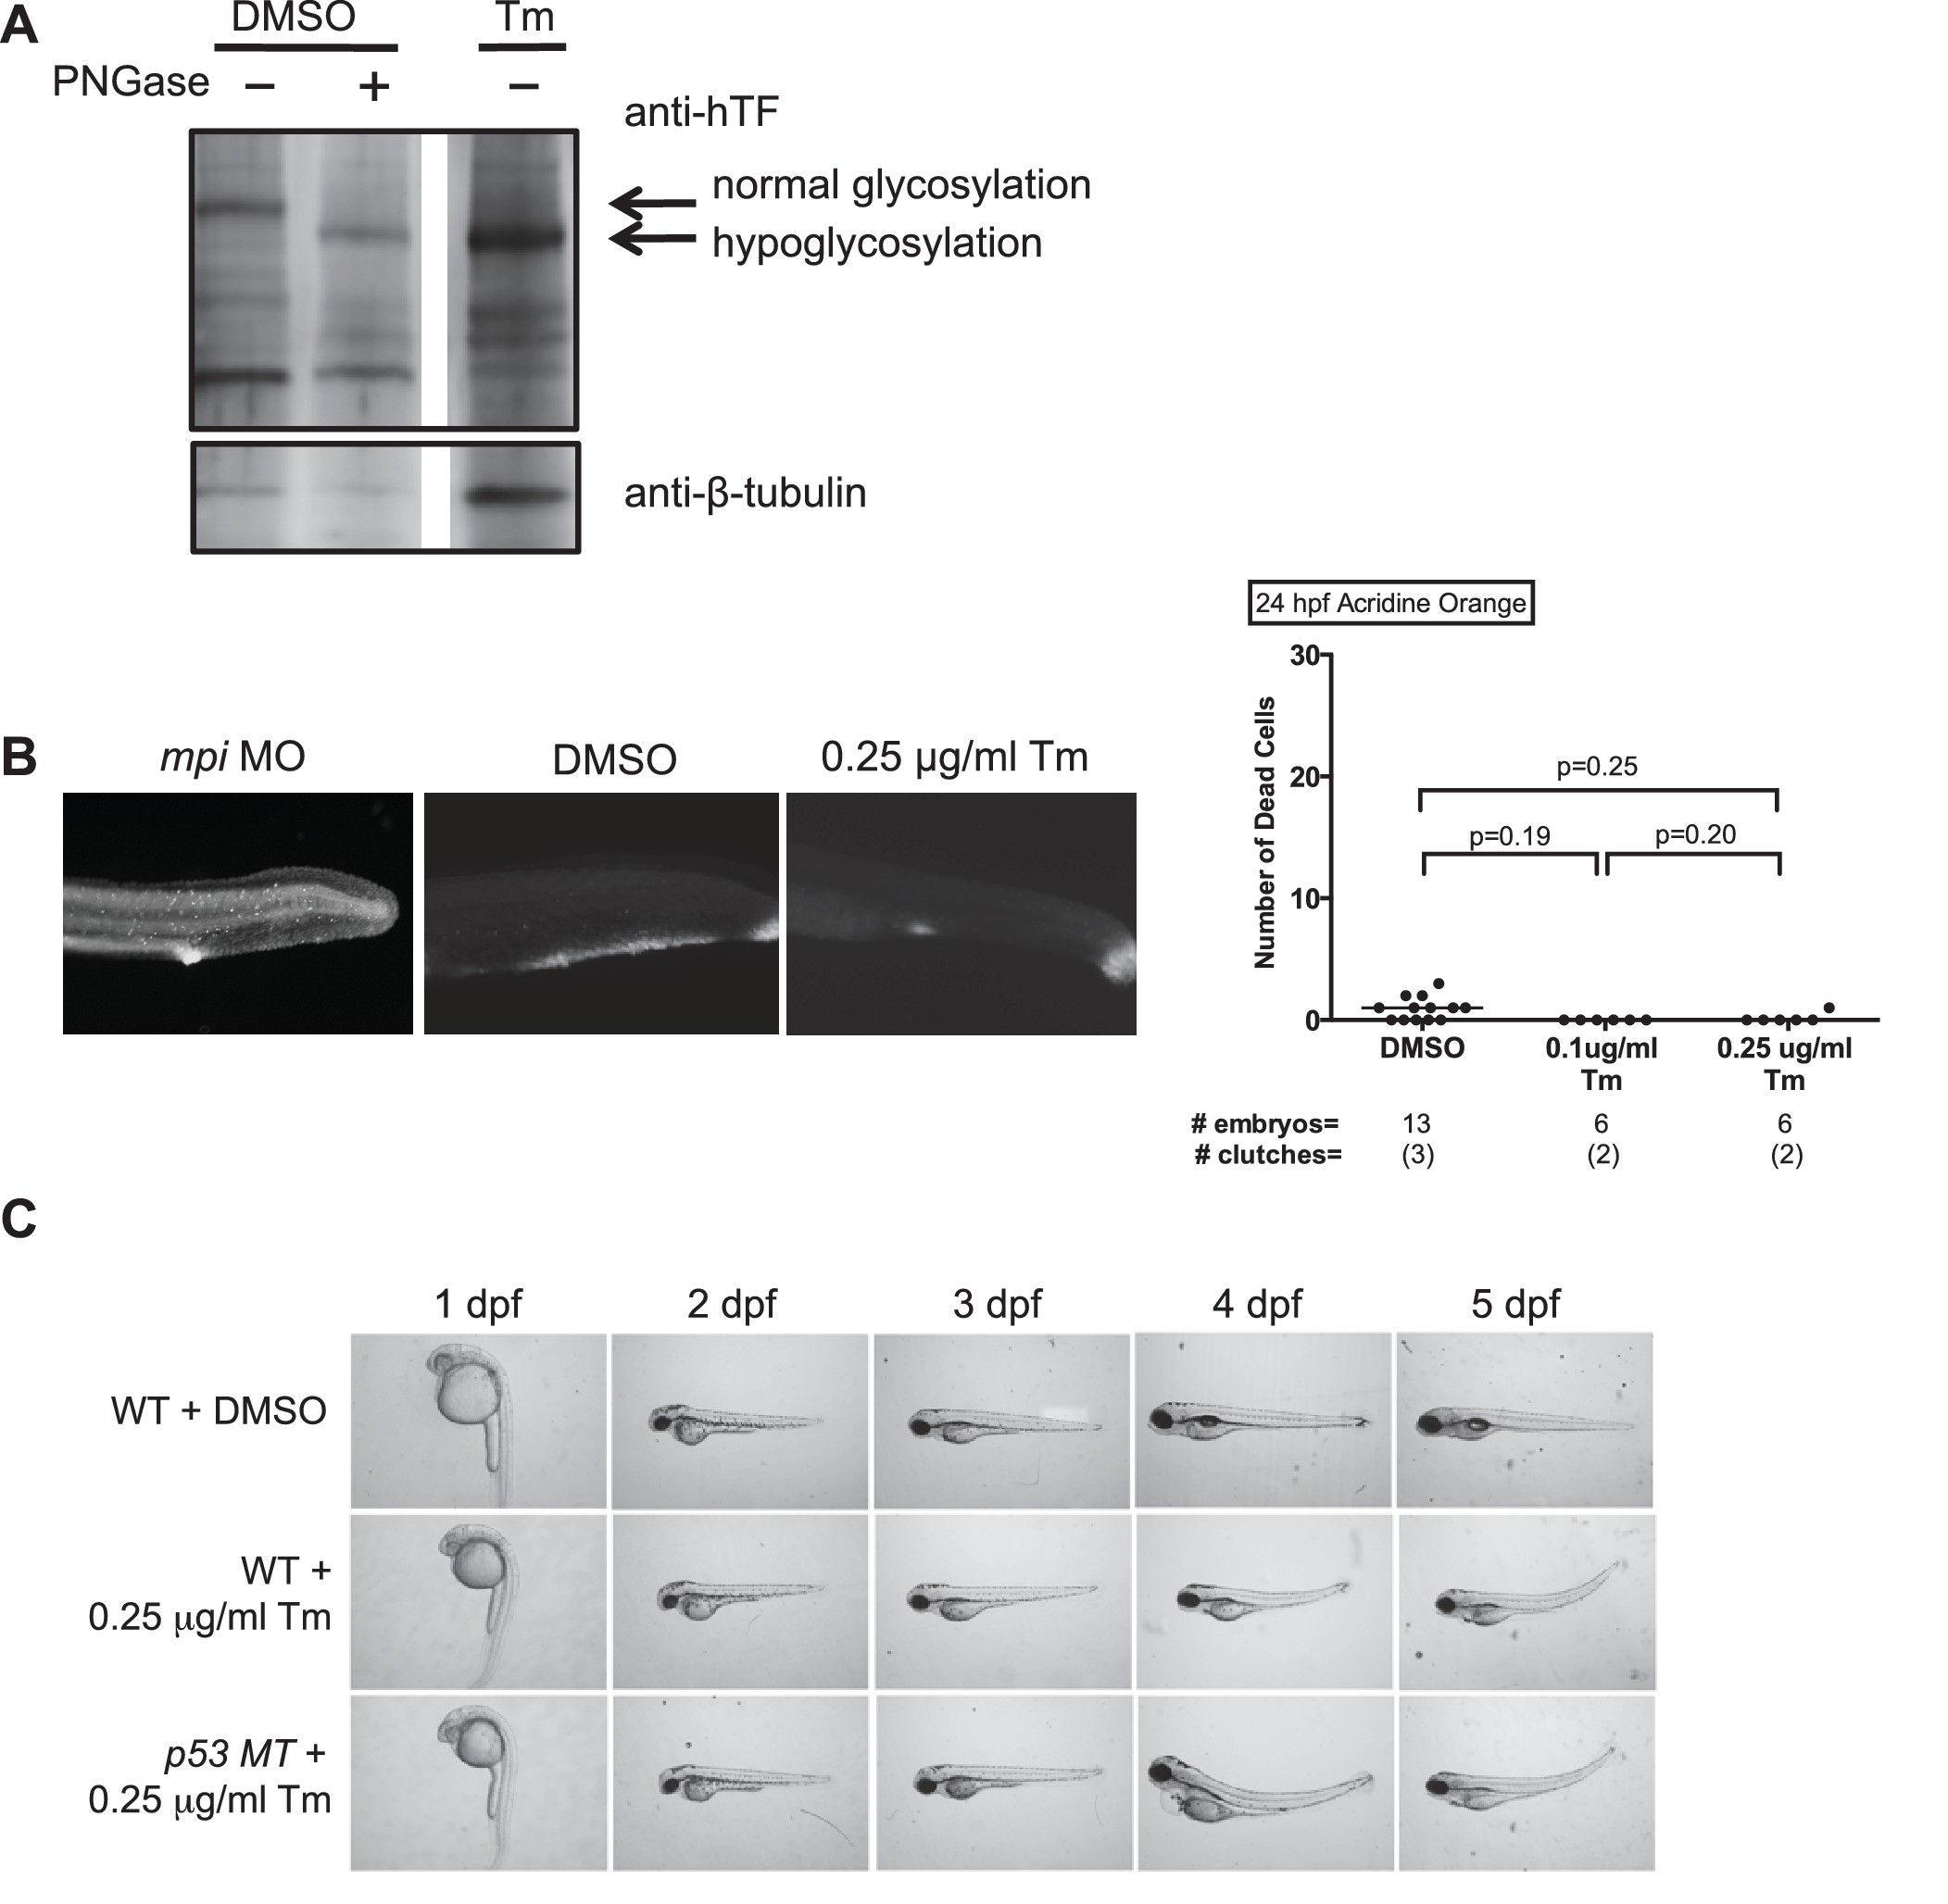
Tm-induced hypoglycosylation does not depend on p53.
(A) Embryos from Tg(fabp10:hTf;cmlc2:EGFP) either treated with DMSO or 0.25 ug/mL Tunicamycin (Tm), and collected at 5 dpf. PNGase F digestion performed to show fully hypoglycosylated moiety. Western blot showing that transferrin (Tf) is hypoglycosylated with Tm treatment. Data representative of three distinct clutches. (B) Acridine orange staining with quantification of cell death (NIS-Elements software) showing minimal cell death in 0.1 or 0.25 µg/ml Tm-treated embryos at 24 hpf (tail shown), as compared to mpi MO. p-Values based on two-tailed paired Student's t test. (C) Time course of morphology of embryos treated with Tm in WT or p53 MT background. Data representative of four distinct clutches.

