Image
Figure Caption
Fig. S4
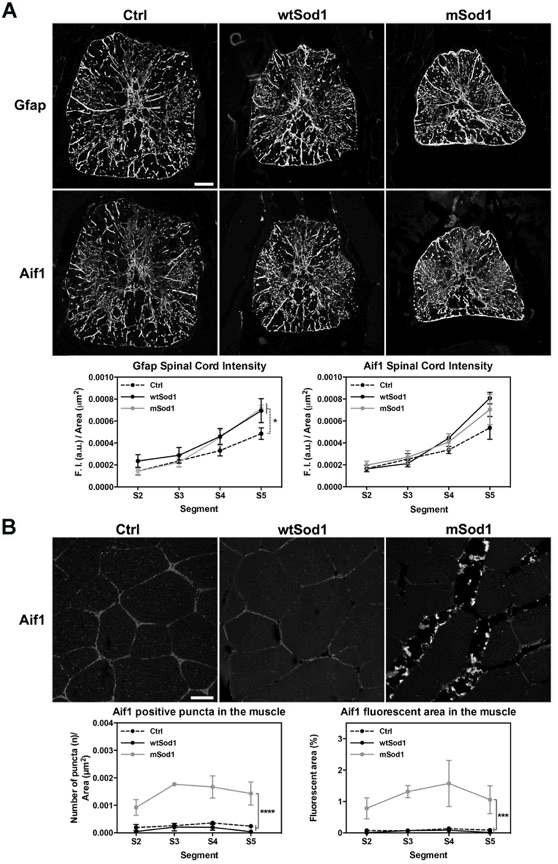
Adult transgenic Sod1 zebrafish show spinal cord reactive astrogliosis but not microgliosis, but only mSod1 fish have activated inflammatory cells in their lateral white muscles.
(A) Reactive astrogliosis and microgliosis were analysed by immunofluorescence in histological sections of 12-month-old zebrafish spinal cord with GFAP (a marker of astrocytes) and Aif1 (a marker of activated microglia in spinal cord and activated macrophages and neutrophils in peripheral tissues), and evaluating the ratio between the mean fluorescence intensity (FI) of both markers and the corresponding spinal cord area (μm2) of segments S2-S5. Each point in the graphs represents the mean values ± SEM of the indicated parameter in each segment of seven Ctrl, six wtSod1 and seven mSod1 zebrafish. There was a significant increase in the fluorescence intensity of GFAP in both transgenic spinal cords, but there were no differences in the Aif1 signals. Scale bar: 25 μm. (B) Confocal images of Aif1-stained S4 lateral white muscle. Scale bar: 25 μm. The atrophic muscle fibres of mSod1 zebrafish are surrounded by areas enriched in activated macrophages and neutrophils: the graphs show a significant increase in the number of Aif1-positive puncta and the percentage area of lateral white muscle covered by Aif1-positive puncta in all of the examined segments. Each point indicates the mean values ± SEM of the indicated parameter in three adult zebrafish of each genotype. The measures were statistically analysed using two-way ANOVA, corrected by means of Sidak’s post-test. *P<0.05; ***P<0.001; ****P<0.0001
Acknowledgments
This image is the copyrighted work of the attributed author or publisher, and
ZFIN has permission only to display this image to its users.
Additional permissions should be obtained from the applicable author or publisher of the image.
Full text @ Sci. Rep.

