Fig. 5
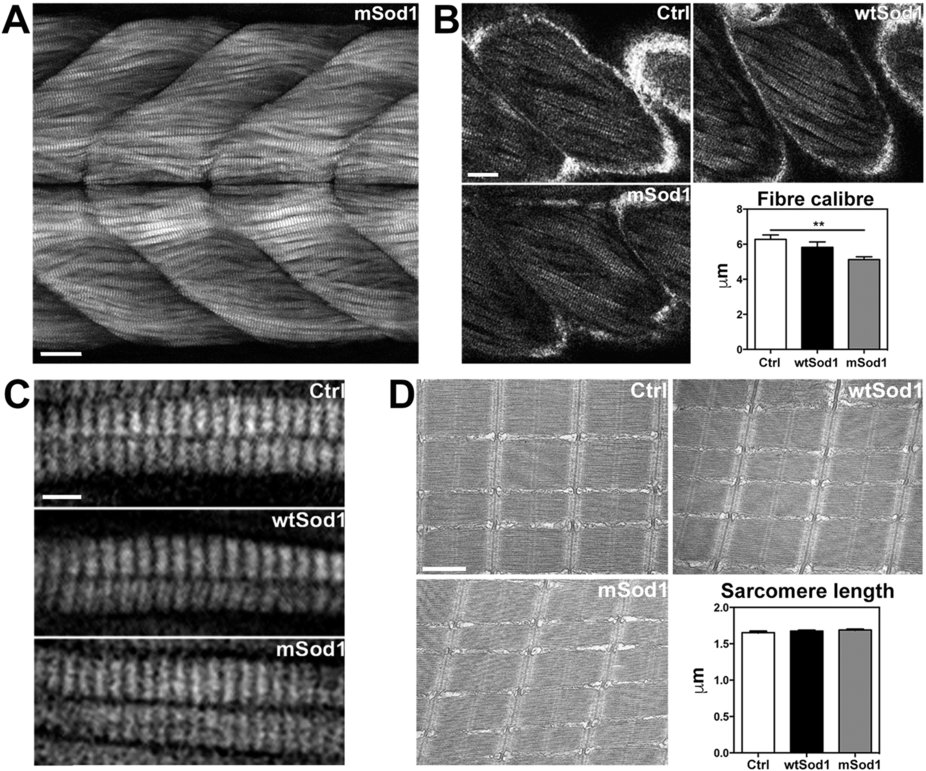
mSod1 larvae show a significant reduction in the calibre of muscle fibres with a preserved sarcomere ultrastructure.
(A) Maximum projection of myosin second harmonic generation (SHG) signal images in the 12–15th somite region of the trunk of mSod1 larvae. Scale bar: 25 μm. (B) Myosin SHG signal images of Ctrl, wtSod1 and mSod1 muscle fibres showing the endogenous myosin signal to quantify muscle fibre calibre (scale bar: 20 μm), which was significantly reduced in the mSod1 than in the control (Ctrl) or wtSod1 larvae (5.13 ± 0.16 μm vs 6.28 ± 0.26 μm and 5.82 ± 0.30 μm). The columns indicate the mean value ± SEM in 17 Ctrl, 15 wtSod1 and 18 mSod1 larvae. The data were statistically analyzed using one-way ANOVA and Tukey’s multiple comparison tests (**P < 0.01). (C) Detail of myosin SHG signal showing sarcomere organization in Ctrl, wtSod1 and mSod1 muscle fibres. Scale bar: 5 μm. No difference in the length of the sarcomeres in the Ctrl, wtSod1 and mSod1 fibres has been detected. (D) Electron micrographs showing the preserved sarcomere ultrastructure in Ctrl, wtSod1 and mSod1 larvae at 96 hpf. Lack of variation in sarcomeres length was confirmed by measuring 100 sarcomeres in two fish per genotype (respectively 1.89 ± 0.03 μm, 1.85 ± 0.03 μm, and 1.90 ± 0.04 μm). The measures were statistically analyzed using one-way ANOVA, corrected by means of Tukey’s post-test.

