
|
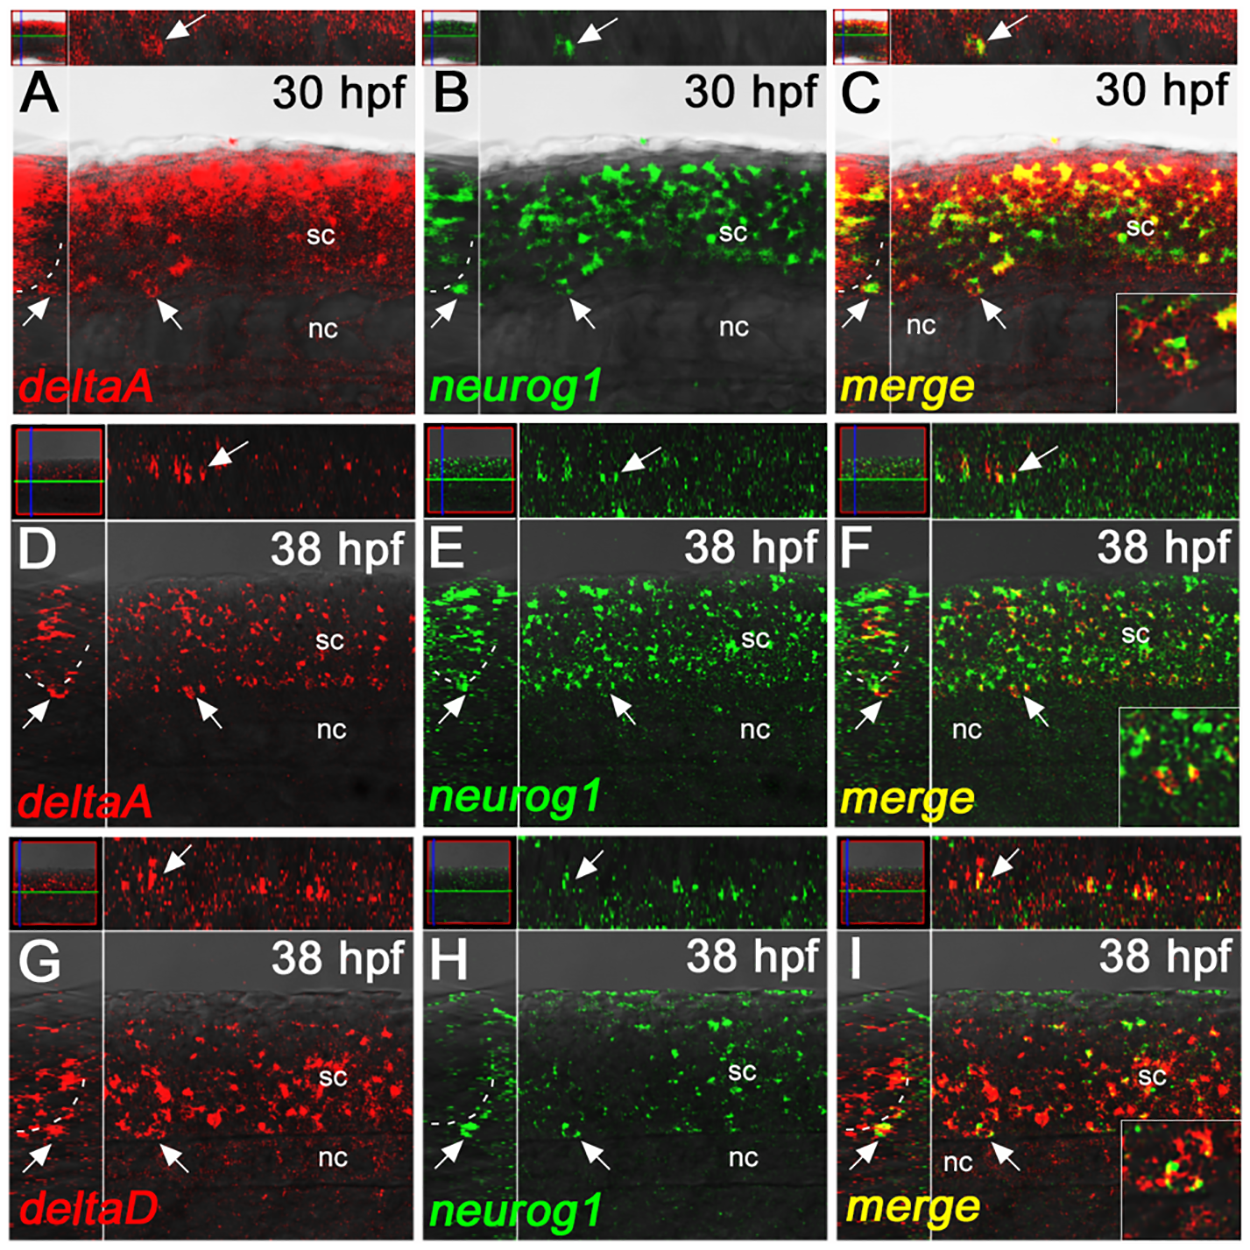
Fig. 4
deltaA and deltaD gene expression overlaps with neurog1 in the nascent DRGs.
A-C) deltaA expression (red) clearly overlaps with neurog1 (green) in the nascent DRG (arrows) at 30 hpf. D-F) At 38 hpf, deltaA expression is clearly seen in the DRGs, but weaker signals make it difficult to discern if expression is in the same cells as express neurog1 or simply in other cells of the ganglia. G-I) deltaD expression (red) clearly overlaps with neurog1 (green) in the nascent DRG (arrows) at 38 hpf. All main panels are confocal images of fluorescent dual-color in situ hybridisations in lateral view, with insets showing y-z planes (left) and x-z planes (above) for each. Insets in the bottom right of panels C, F and I show enlargements of the double-labeled cells indicated by the arrows. nc, notochord; sc, spinal cord.