
|
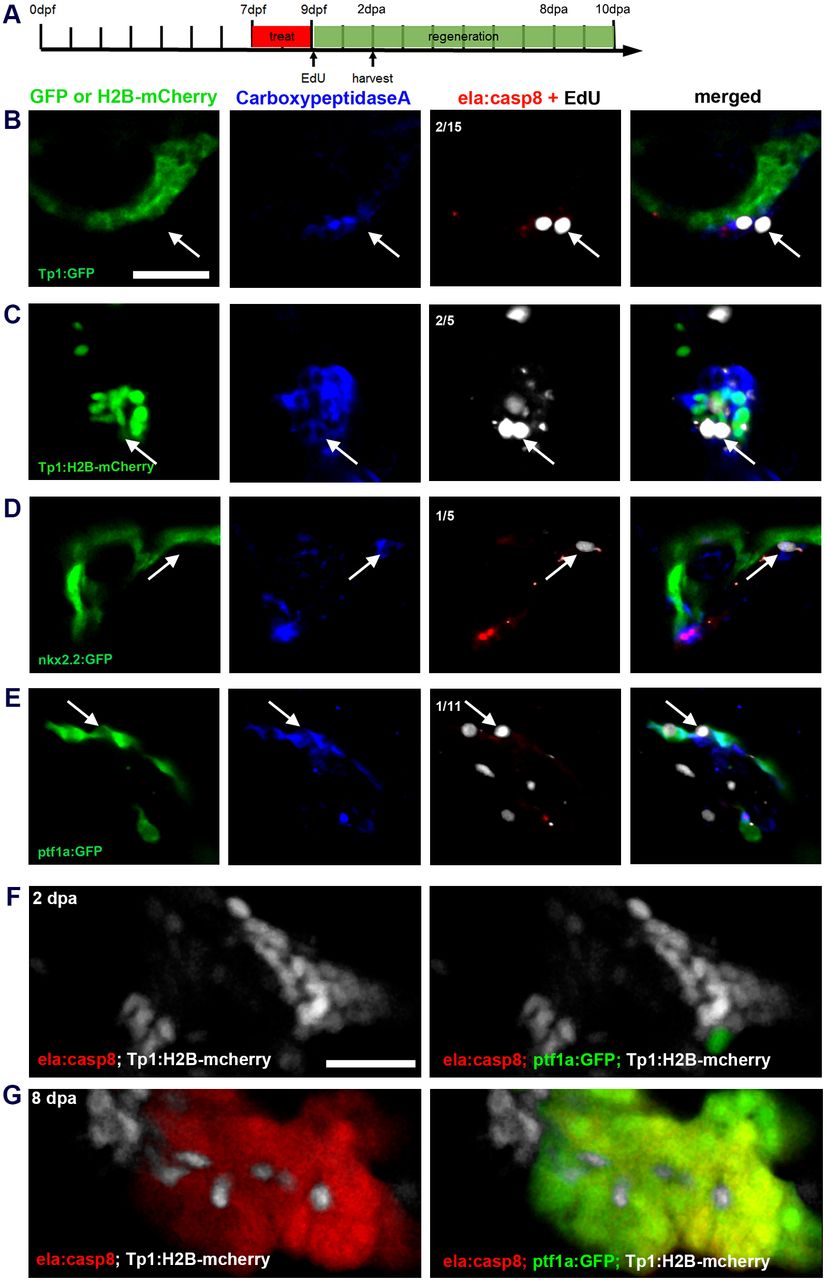
Fig. 4
Identification of progenitor cells in the regenerating exocrine pancreas. (A) Timeline of short-term regeneration experiments shown in B-E indicating the time window of Dim treatment (red, 7-9?dpf), starting point of EdU treatment (0?dpa) and the fixation time (2?dpa). (B-E) Confocal image projection showing different lineage reporters (green), CPA antibody signals (blue), EdU signals (white, arrows indicate proliferating CPA+ cells) and E2Crimson (red; in C, E2Crimson and EdU staining are both shown white due to the Tp1:H2B-mcherry background). Note that CPA+ cells are negative for duct/NRC reporter expression in Tp1:eGFP (B), Tp1:H2B-mcherry (C) and nkx2.2:eGFP (D), whereas CPA signals match expression of ptf1a:GFP (E). (F,G) Comparison of reporter expression for NRCs (Tp1:H2B-mcherry, white), Ptf1a+(ptf1a:eGFP; green) and ela3l+ (ela:casp8, red) in triple transgenic larva at 2?dpa (F) and 8?dpa (G). NRCs signals localize next to Ptf1a+ cells at 2?dpa (F) and they intermingle with Ptf1a+ and ela3l+ labels at 8?dpa (G), but they do overlap with these markers. Scale bars: 20?�m.