Fig. 3
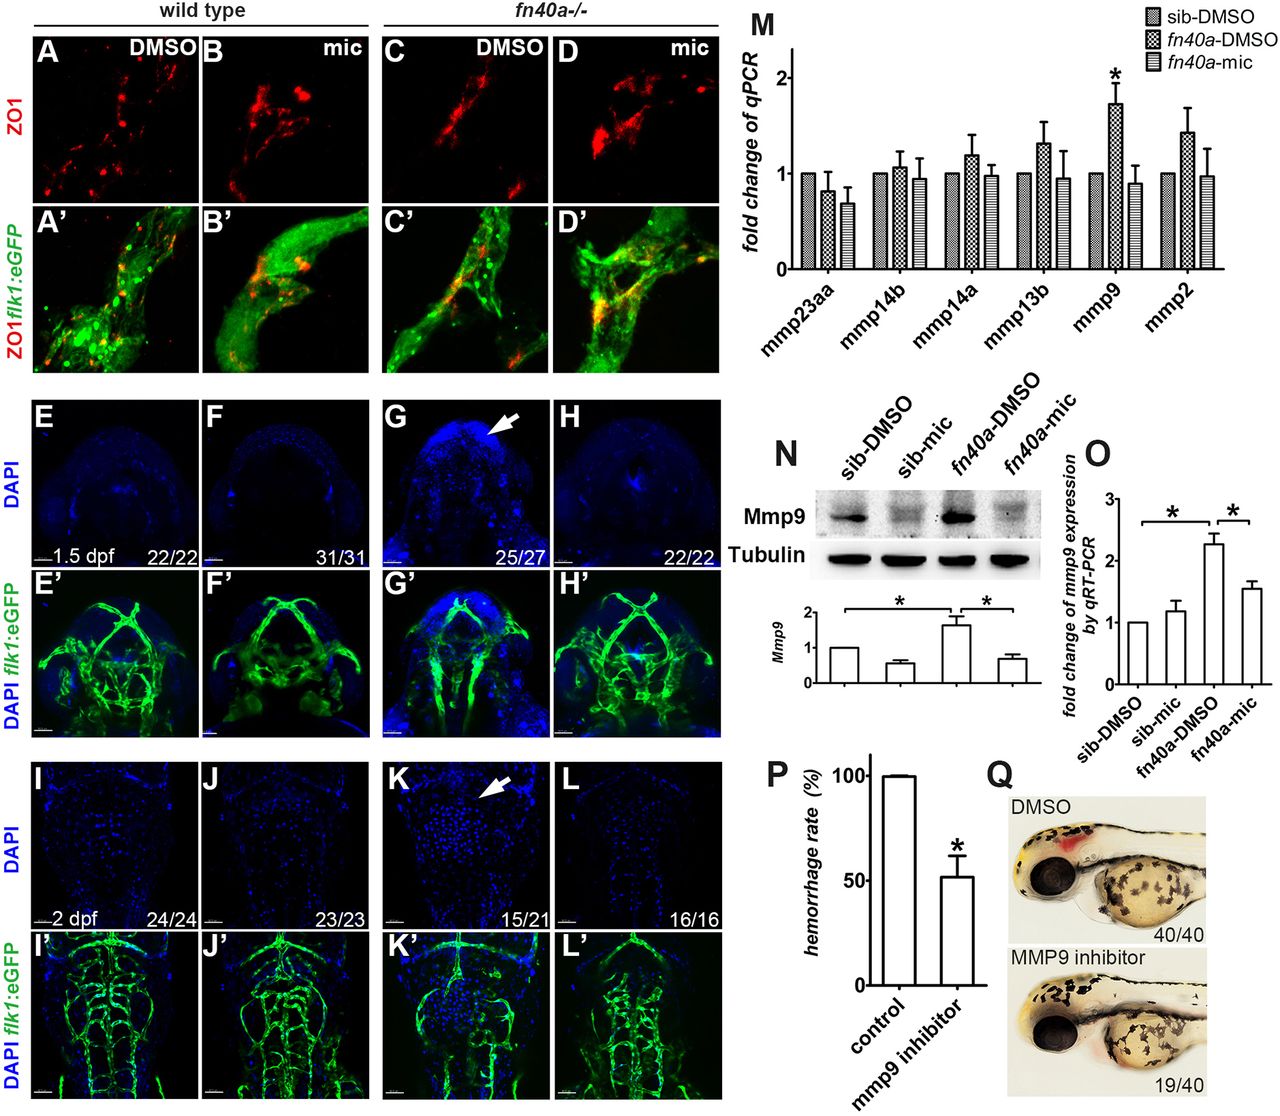
Miconazole suppresses brain hemorrhages by preventing Mmp9-mediated vessel disruption in fn40a?/? mutants. (See also Fig. S5). (A-D?) Fluorescence immunohistochemistry reveals comparable expression of the tight junction protein ZO1 in Tg(flk1:eGFP)-labeled brain vessels with or without miconazole (mic) treatment in wild-type siblings (A-B?) and fn40a mutants (C-D?) at 2?dpf. Images are representative of more than 15 embryos per group (n>15). (E-L?) Microinjection of DAPI into the sinus venous revealed that neurons are stained by leaked DAPI before (G,G?, arrow) and after (K,K?, arrow) evident hemorrhages, suggesting that vascular permeability increases in homozygous fn40a mutants. This was rescued by mic treatment (H,H?,L,L?), compared with much less leakage of DAPI in siblings with or without mic treatment (E-F?,I-J?). E-H? are embryos at 1.5?dpf, I-L? are embryos at 2?dpf. The numbers on the lower right show the number of phenotypical embryos out of the total embryos scored. Scale bars: 100?µm. (M) Quantitative real-time PCR identified that mmp9, but not other MMP genes, is upregulated in homozygous fn40a mutants and that was suppressed to the normal level by mic treatment at 2 dpf. *P<0.05 by two-way ANOVA with Bonferroni post-tests, compared with sib-DMSO group for each gene; meansħs.e.m. (N,O) Western blot (N) and qRT-PCR (O) confirmed that both MMP9 protein and mmp9 mRNA increases in the mutants with DMSO control treatment and this is normalized by mic treatment, compared with wild-type siblings with or without mic treatment at 2?dpf. *P<0.05 by one-way ANOVA with Bonferroni's multiple comparison test, meansħs.e.m. Total RNA was extracted from whole embryos and protein from whole embryos without yolk. (P,Q) MMP9 inhibitor I suppresses brain hemorrhage rate to 50% in homozygous mutants (P), in which brain hemorrhage was scored in live mutant embryos treated with DMSO or MMP9 inhibitor (Q). *P<0.05 by Student's t-test, compared with controls; meansħs.e.m.

