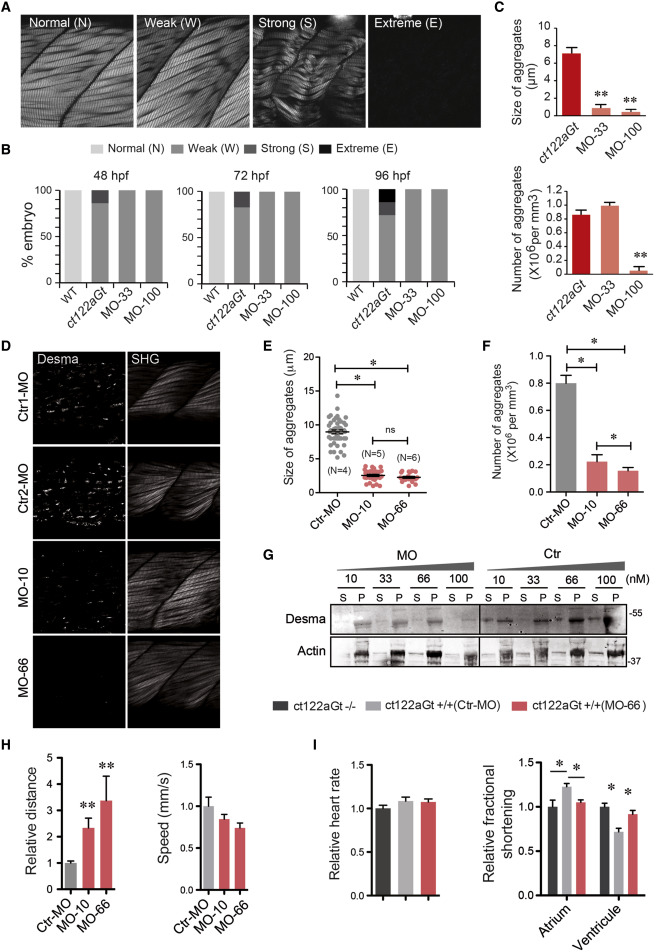
Fig. 6
Reduction of Desma Level Ameliorates Skeletal and Cardiac Muscle Phenotypes Observed in desmact122aGt Homozygous Embryos
(A) Classification of the skeletal muscle phenotypes obtained with SHG. Normal phenotype is attributed to embryos with similar muscle shape as the controls. Weak phenotype corresponds to the situation where muscle fibers are misaligned or present abnormal curvatures. A strong phenotype is attributed when embryonic muscle display degenerated and/or broken fibers, a global decrease in the size of the musculature or a global decrease in the intensity of the SHG signal. A phenotype is called extreme when the muscle disorganization is such that no SHG signal is observed anymore. Scale bar, 30 μm.
(B) Evaluation of phenotypes in ct122aGt injected with the 33 and 100 μM MO, uninjected, and WT embryos from 48 to 96 hpf. The assessment of a phenotype is based on the scale presented in (A) after SHG imaging.
(C) Size and number of aggregates in ct122aGt injected with two different concentrations of MO (33 and 100 μM). Embryos injected with 100 μM present a high reduction in aggregate numbers, while 33 μM of MO did not reduce the aggregate number.
(D) Images of aggregates and corresponding SHG in ct122aGt embryos treated with 10- and 66-nM concentrations of MO or the corresponding control (Ctr). Scale bar, 30 μm.
(E and F) Two additional concentration of MO showed a dose-dependent reduction in size and number of aggregates.
(G) All the tested concentration were employed to monitor desmin solubility index = Triton X-100 soluble desmin (S)/insoluble or pellet (P) in whole zebrafish extracts. Actin is the loading control.
(H) Decreased desma level by MO treatment improves fish mobility but does not impact speed.
(I) MO-mediated desma knockdown restore normal cardiac fractional shortening in ct122aGt line. ct122aGt indicates desmact122aGt homozygous embryos.
The error bars correspond to the SEM.

