
|
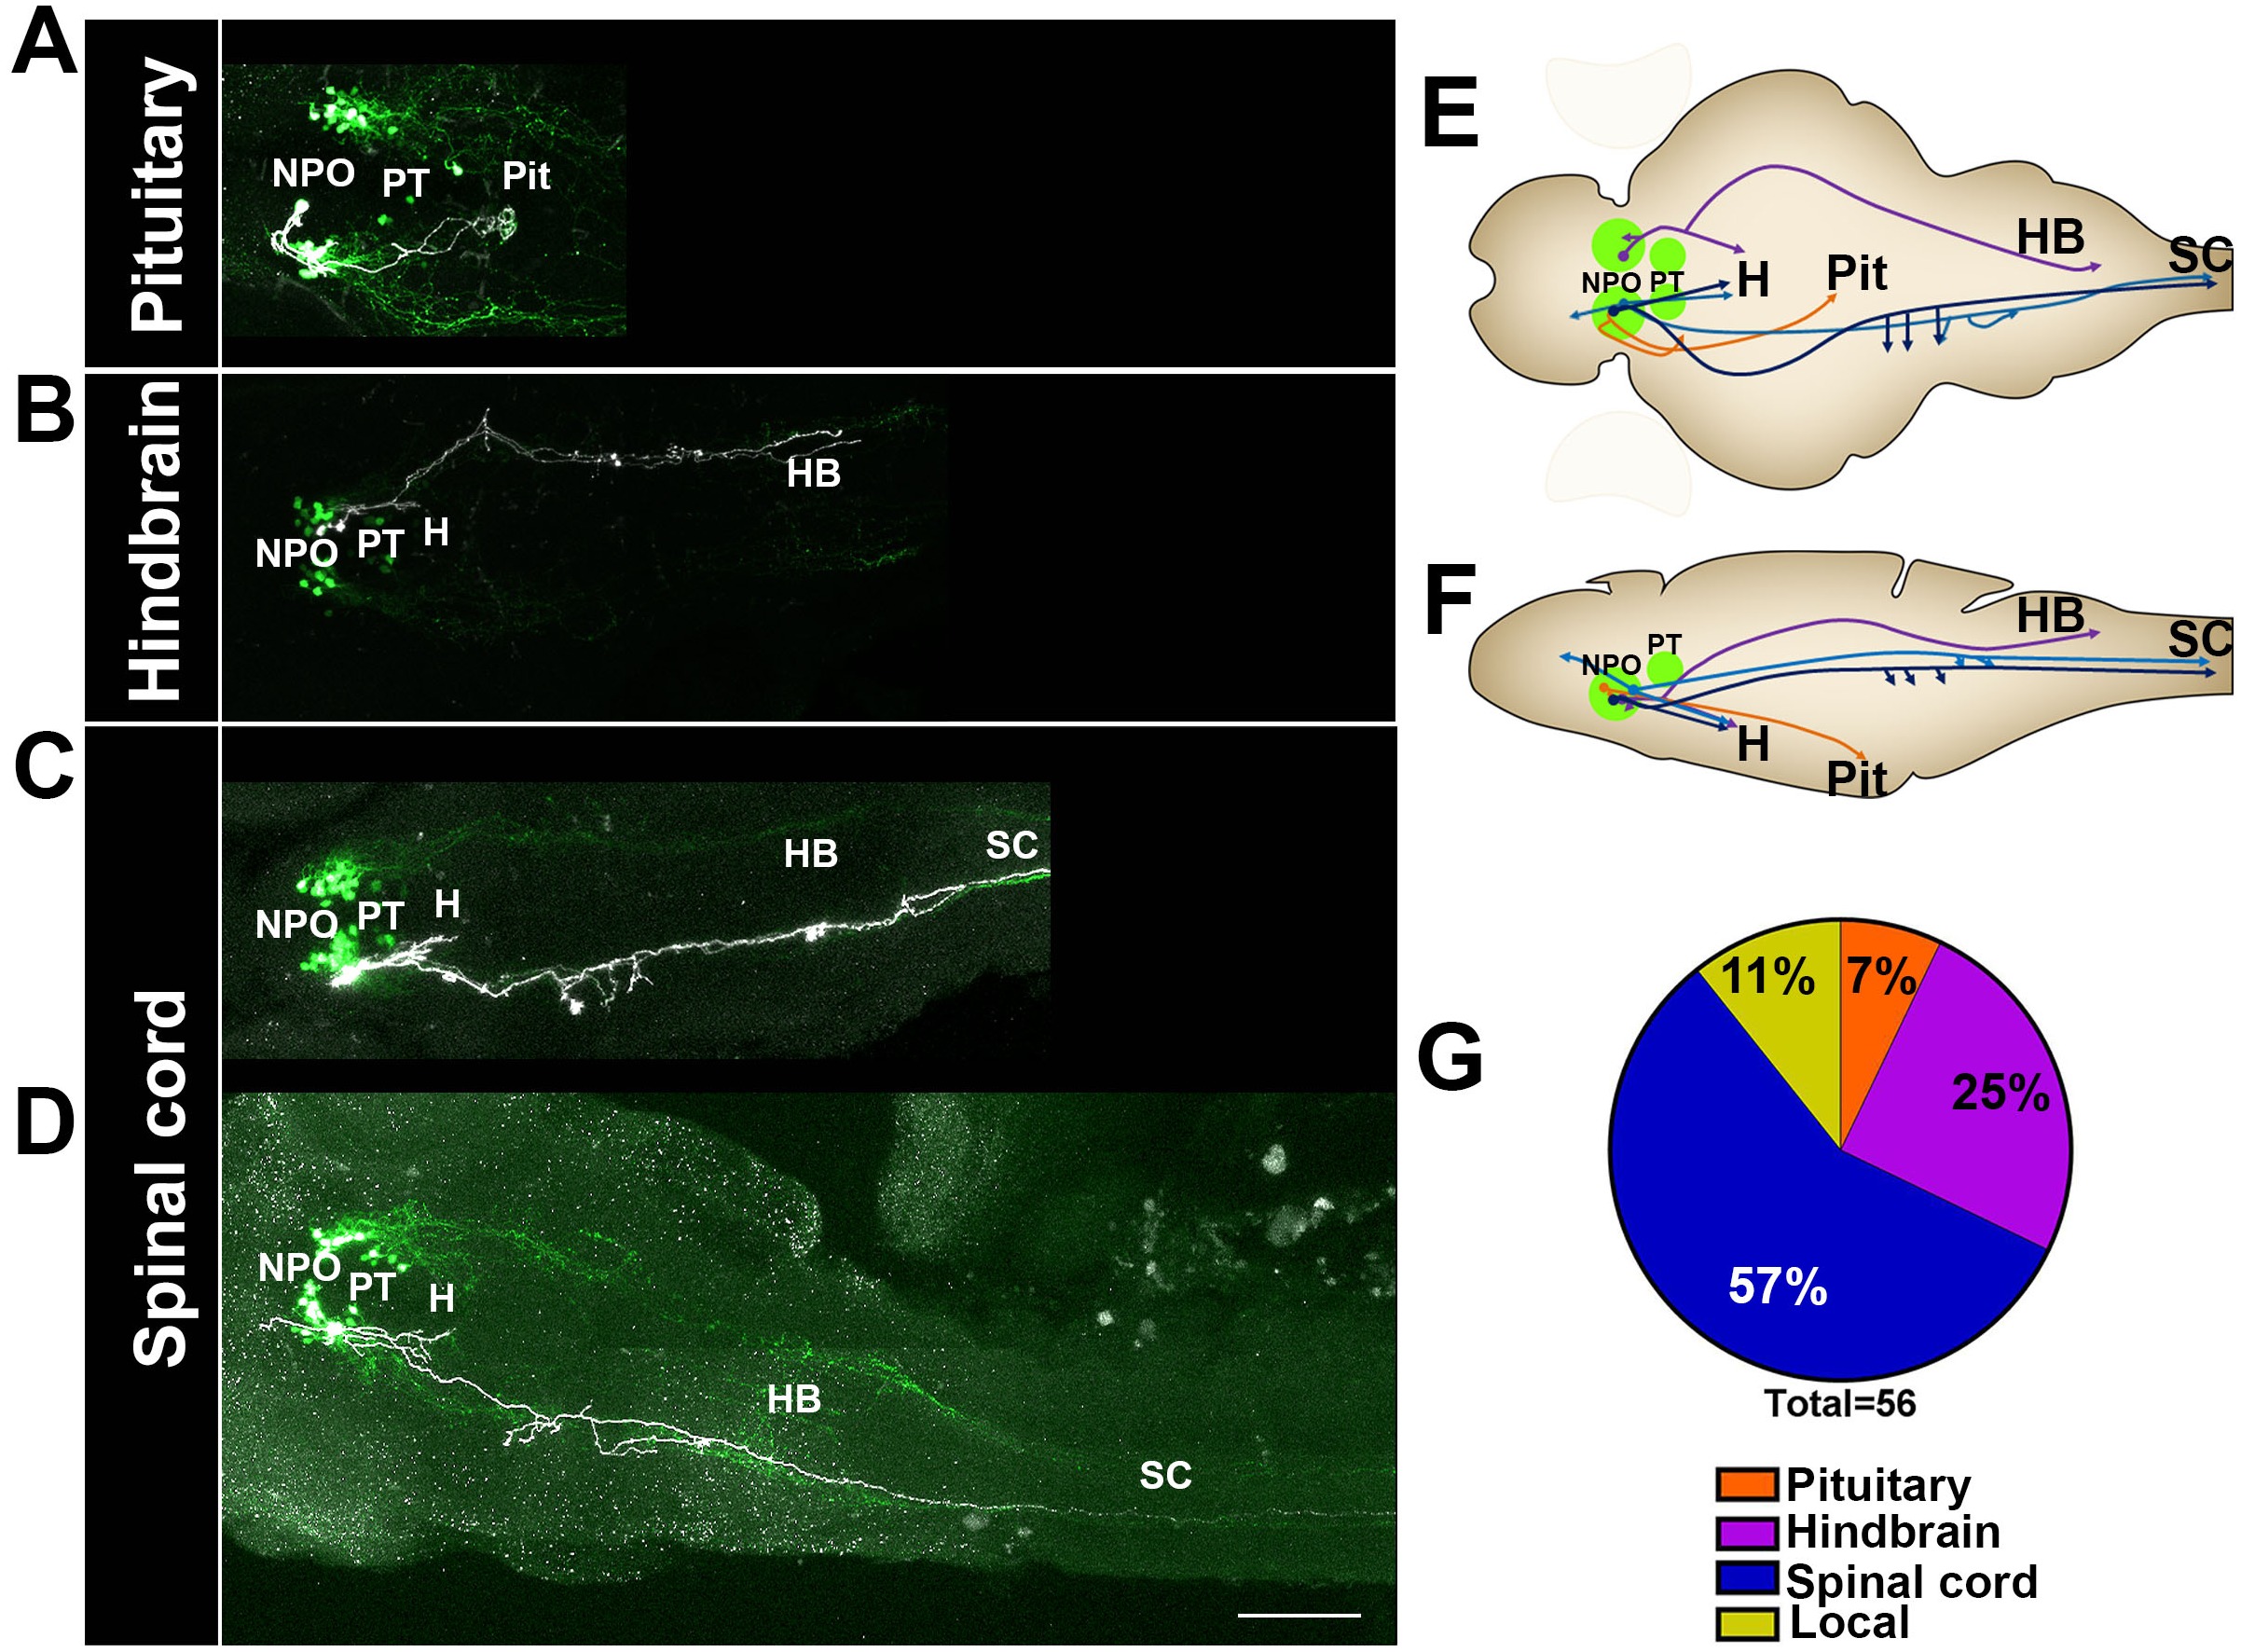
Fig. 6
Single-cell projection mapping of anterior (NPO) OXT-ergic trajectories.
(A?D) Confocal images showing representative single-cell genetic labeling of the NPO OXT neurons (grey scale) in the context of the global OXT-ergic population in a oxt:egfp reporter (green). In short, the Tg(oxt:egfp) reporter line was microinjected with OXT-specific Gal4 driver, (oxt:Gal4) construct together with constructs harbouring membrane localized caax-tRFP under the control of a multimerized Gal4 upstream activation sequence (10xUAS). Neuronal projections of RFP-labelled cells were traced and reconstituted from the 3D confocal Z-Stack. Examples of single-cell labeling of OXT projections to the posterior pituitary/neurohypophysis (A; Pit), hindbrain (B; HB) and spinal cord (C, D; SC) as well as local projections to the hypothalamus (labelled ?H? in panels C and D) are shown. Scale bar, 100 �m. (E,F) Schemes illustrating dorsal (E) and lateral (F) views of the traced projecting neurons. (G) Pie chart showing the percentage of each type of projecting OXT neurons, which reside in the NPO.