
|
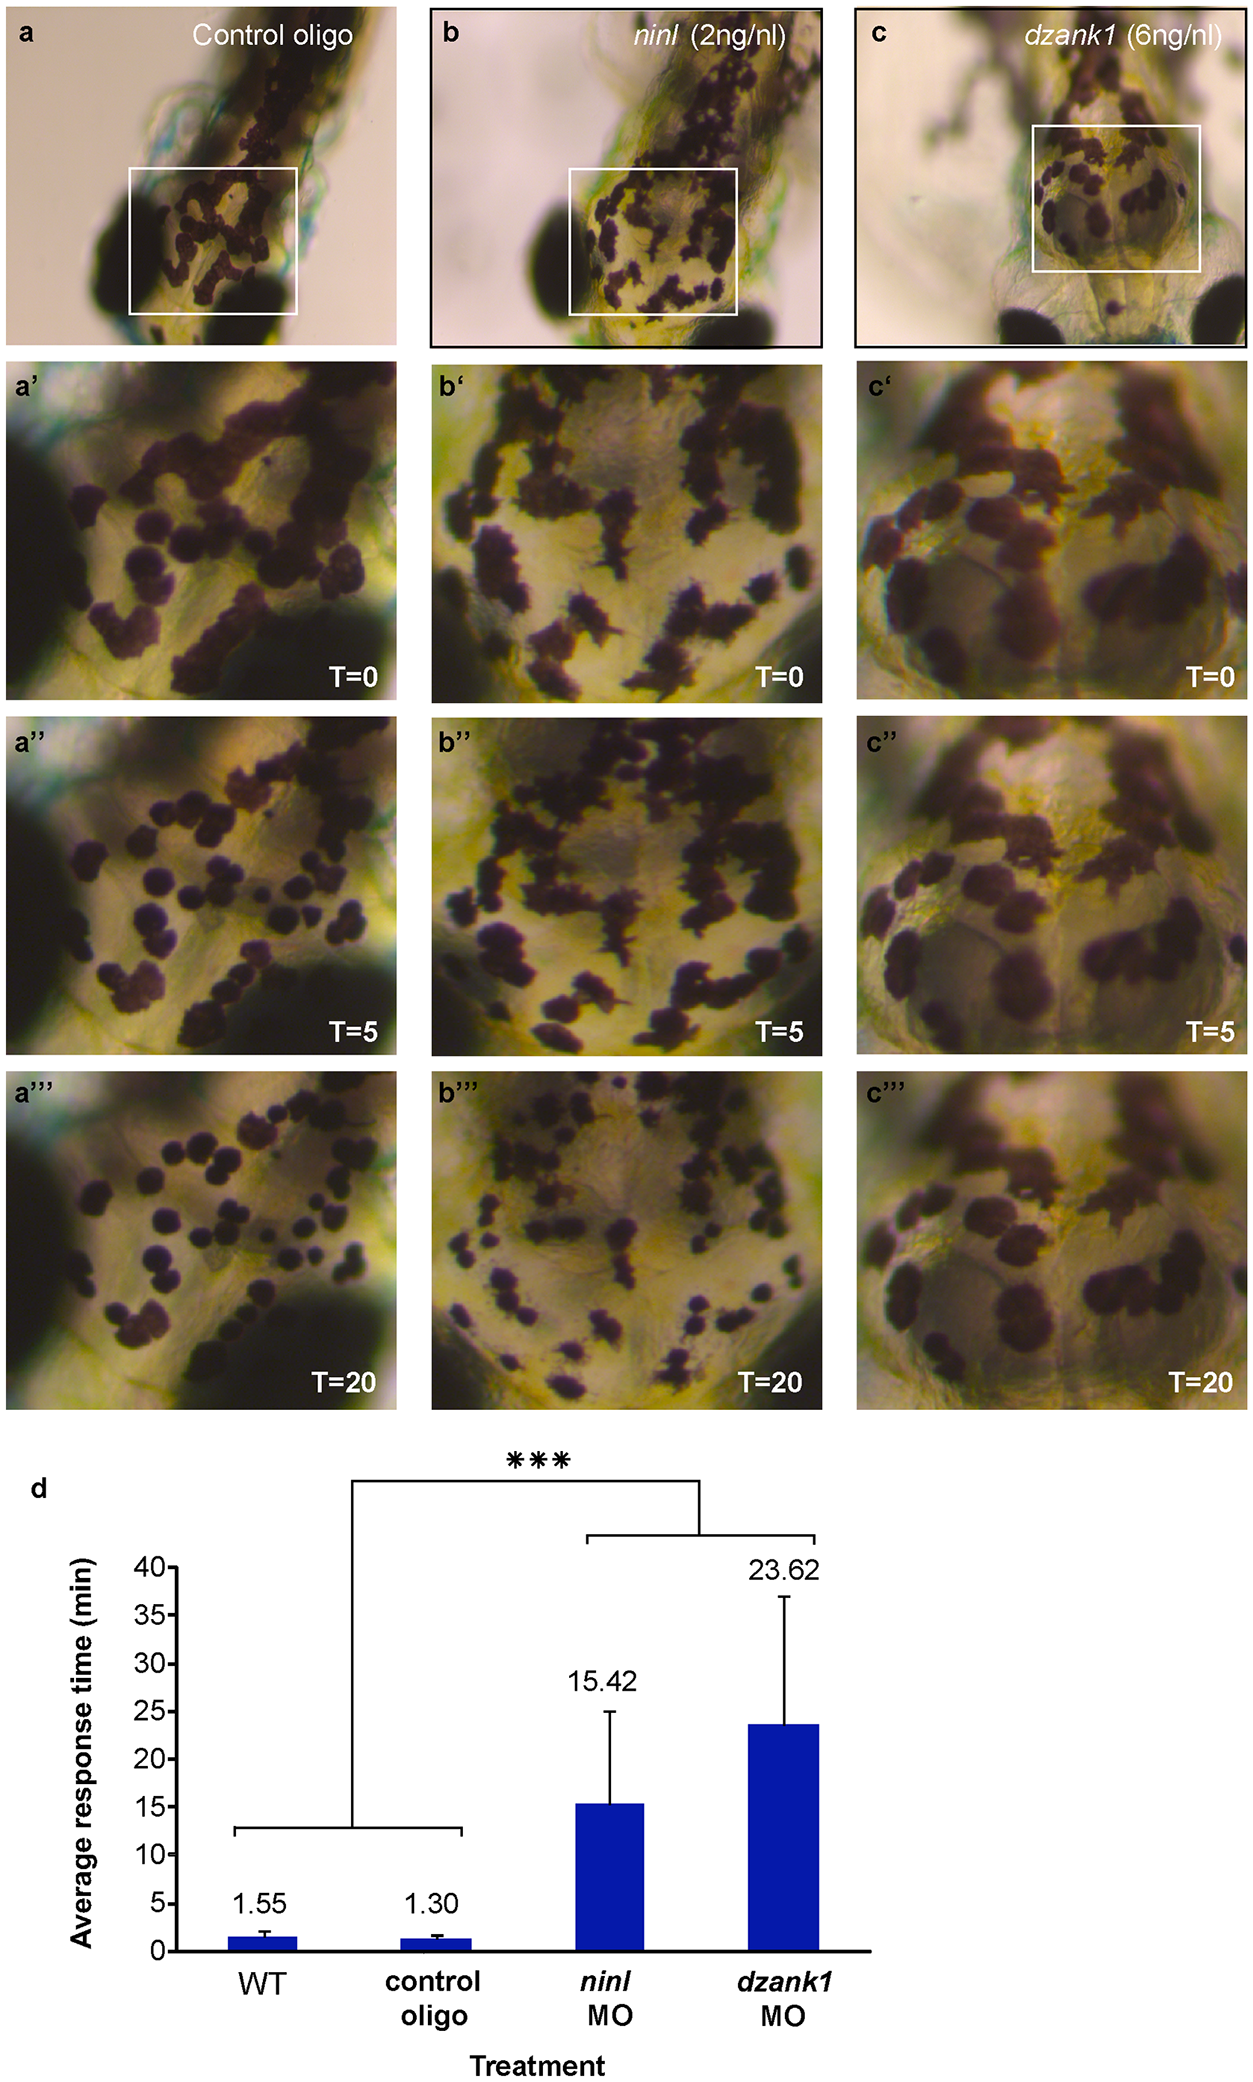
Fig. 7
ninl and dzank1 knockdown results in epinephrine-induced melanosome retraction delay.
Control MO-injected larvae (10 ng/nl; n = 20) at 5 dpf (a-a'''), ninl morphant (2 ng/nl; n = 20) (b-b''') and dzank1 morphant (6 ng/nl; n = 20) (c-c'''). White Box denotes the area at higher magnification (40x) (a'-c''). (a-c') Melanosome pattern of the different larvae before treatment, (a''-c''), 5 min after epinephrine addition and (a'''-c''') 20 min after epinephrine addition, t represents time in minutes. (d) Graphical representation with error bars (standard deviation) demonstrating a significant delay of epinephrine-induced melanosome retrograde trafficking compared with wild-type and control MO-injected (10 ng/nl) larvae. Treatment (control, ninl- or dzank1-morphants) is noted on the x-axis and average response time in minutes is noted on the Y-axis. ***: P<0.001 (two-tailed, unpaired Student's t-test).