Image
Figure Caption
Fig. S11
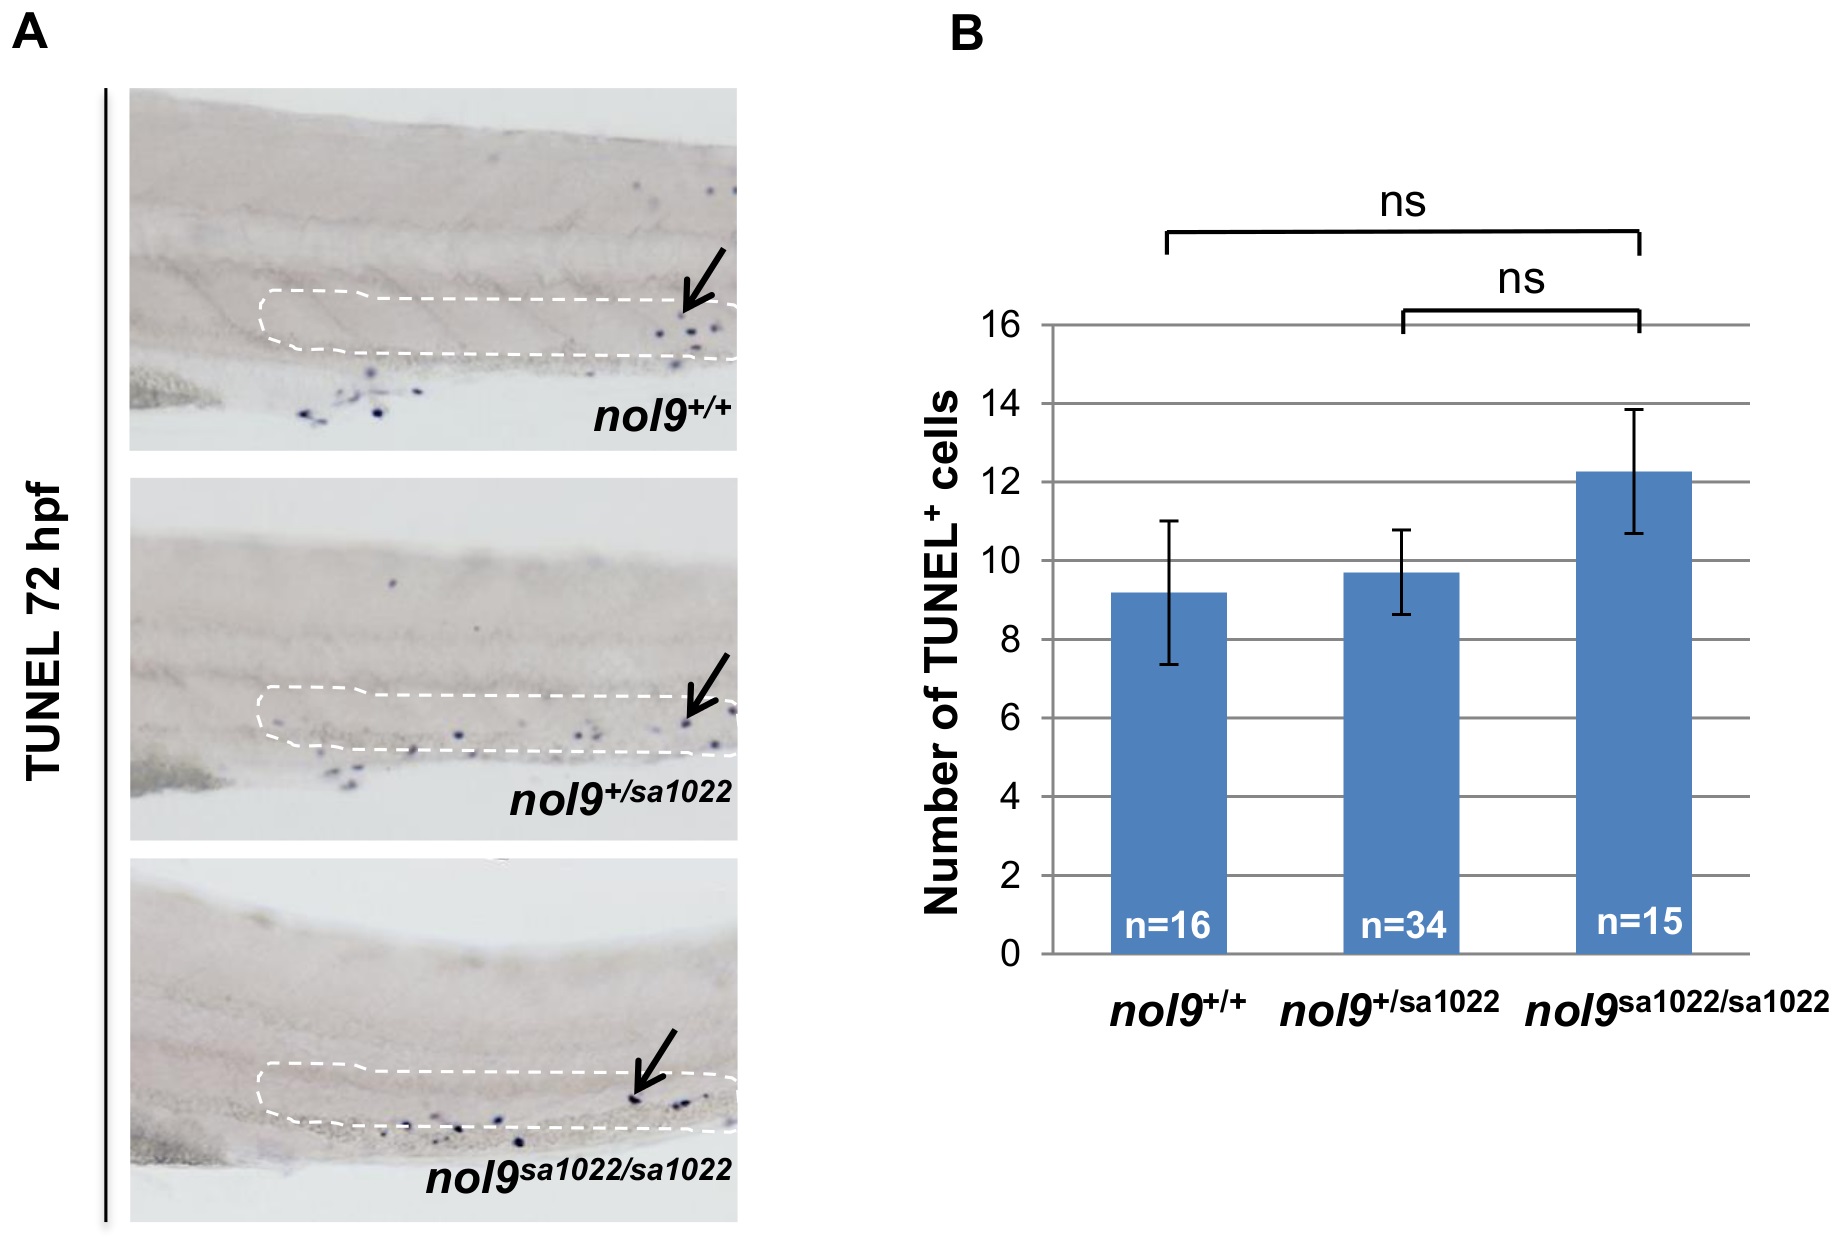
Apoptosis in the CHT assessed by TUNEL assay.
(A) The CHT region of 72 hpf larvae stained with TUNEL assay. nol9sa1022/sa1022 mutants do not exhibit an increase in the number of TUNEL-positive apoptotic cells (arrow) compared to wt siblings in the CHT region (as outlined). All larvae are oriented with anterior to the left and dorsal to the top. (B) The average number of TUNEL-positive apoptotic cells in the CHT region in nol9+/+ (n = 16), nol9+/sa1022 (n = 34) and nol9sa1022/sa1022 (n = 15) larvae at 72 hpf. Data are represented as the mean +/- SEM; One way ANOVA, ns?not significant.
Acknowledgments
This image is the copyrighted work of the attributed author or publisher, and
ZFIN has permission only to display this image to its users.
Additional permissions should be obtained from the applicable author or publisher of the image.
Full text @ PLoS Genet.

