
Image
|
Figure Caption
Fig. 1
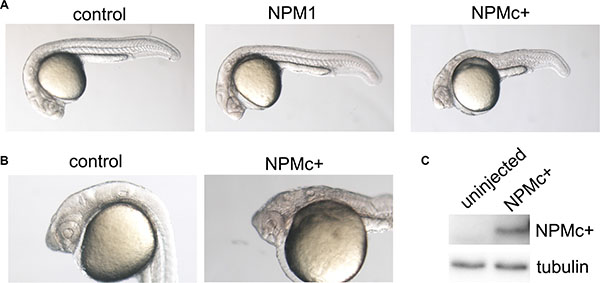
Embryo morphology after NPM1 and NPMc+ expression in zebrafish embryos. (A) Overall view of control (uninjected), NPM1 (90% of injected embryos showing the reported phenotype) and NPMc+ (85% of injected embryos showing the reported phenotype in multiple experiments) expressing embryos at 24 hpf. (B) Head structures in control and NPMc+ expressing embryos at 24 hpf. (C) Western blot analysis of NPMc+ expression levels in zebrafish embryos.
Acknowledgments
This image is the copyrighted work of the attributed author or publisher, and
ZFIN has permission only to display this image to its users.
Additional permissions should be obtained from the applicable author or publisher of the image.
Full text @ Oncotarget