Fig. 5
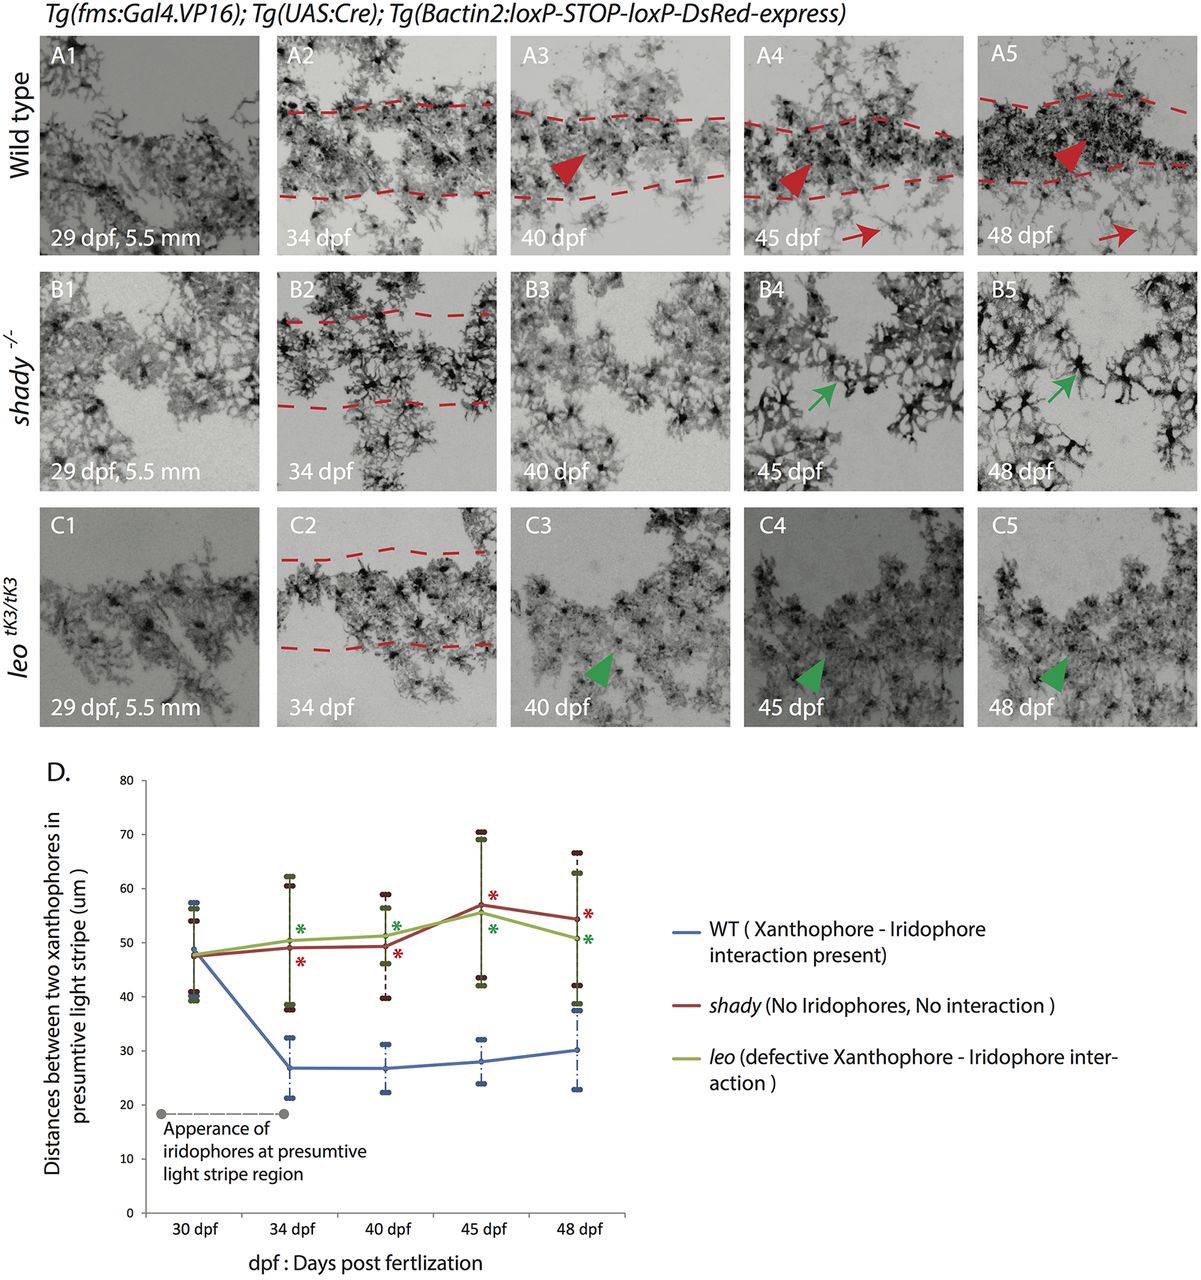
Development of xanthophore distribution and organization during stripe pattern formation. Time-lapse images of DsRed-positive xanthophores labeled with Tg(fms:Gal4.VP16); Tg(UAS:Cre); Tg(?actin2:loxP-STOP-loxP-DsRed-express) in wild type and mutants during metamorphosis. (A1-5) Wild-type xanthophores reorganize upon the arrival of metamorphic iridophores and melanophores form a uniform density into two different forms: stellate and less dense (red arrowhead) in the dark-stripe areas (between the red dotted lines), and compact and dense in the light-stripe areas (red arrowheads). (B1-5) Xanthophores in shady mutants stay at a uniform density (green arrow) in the dark-stripe areas (between the red dotted lines). (C1-5) In homozygous leotK3 mutants xanthophores stay at a uniform density (green arrowhead) all over the body of the fish even after the arrival of iridophores and melanophores, dark-stripe areas are shown between red dotted lines. Scale bars: 100?Ám. (D) Graph showing the differences in cell densities during development of wild type, leotK3 and shady mutants. The distances (in Ám) between the centers of neighboring xanthophores in the prospective light-stripe regions at various developmental time points are depicted (n=25 cell pairs from 5 fish per genotype). Error bars indicate standard deviations. Asterisks indicate the statistical significance compared to wild type using Student's t-test (all P values are P<0.0001).

