
|
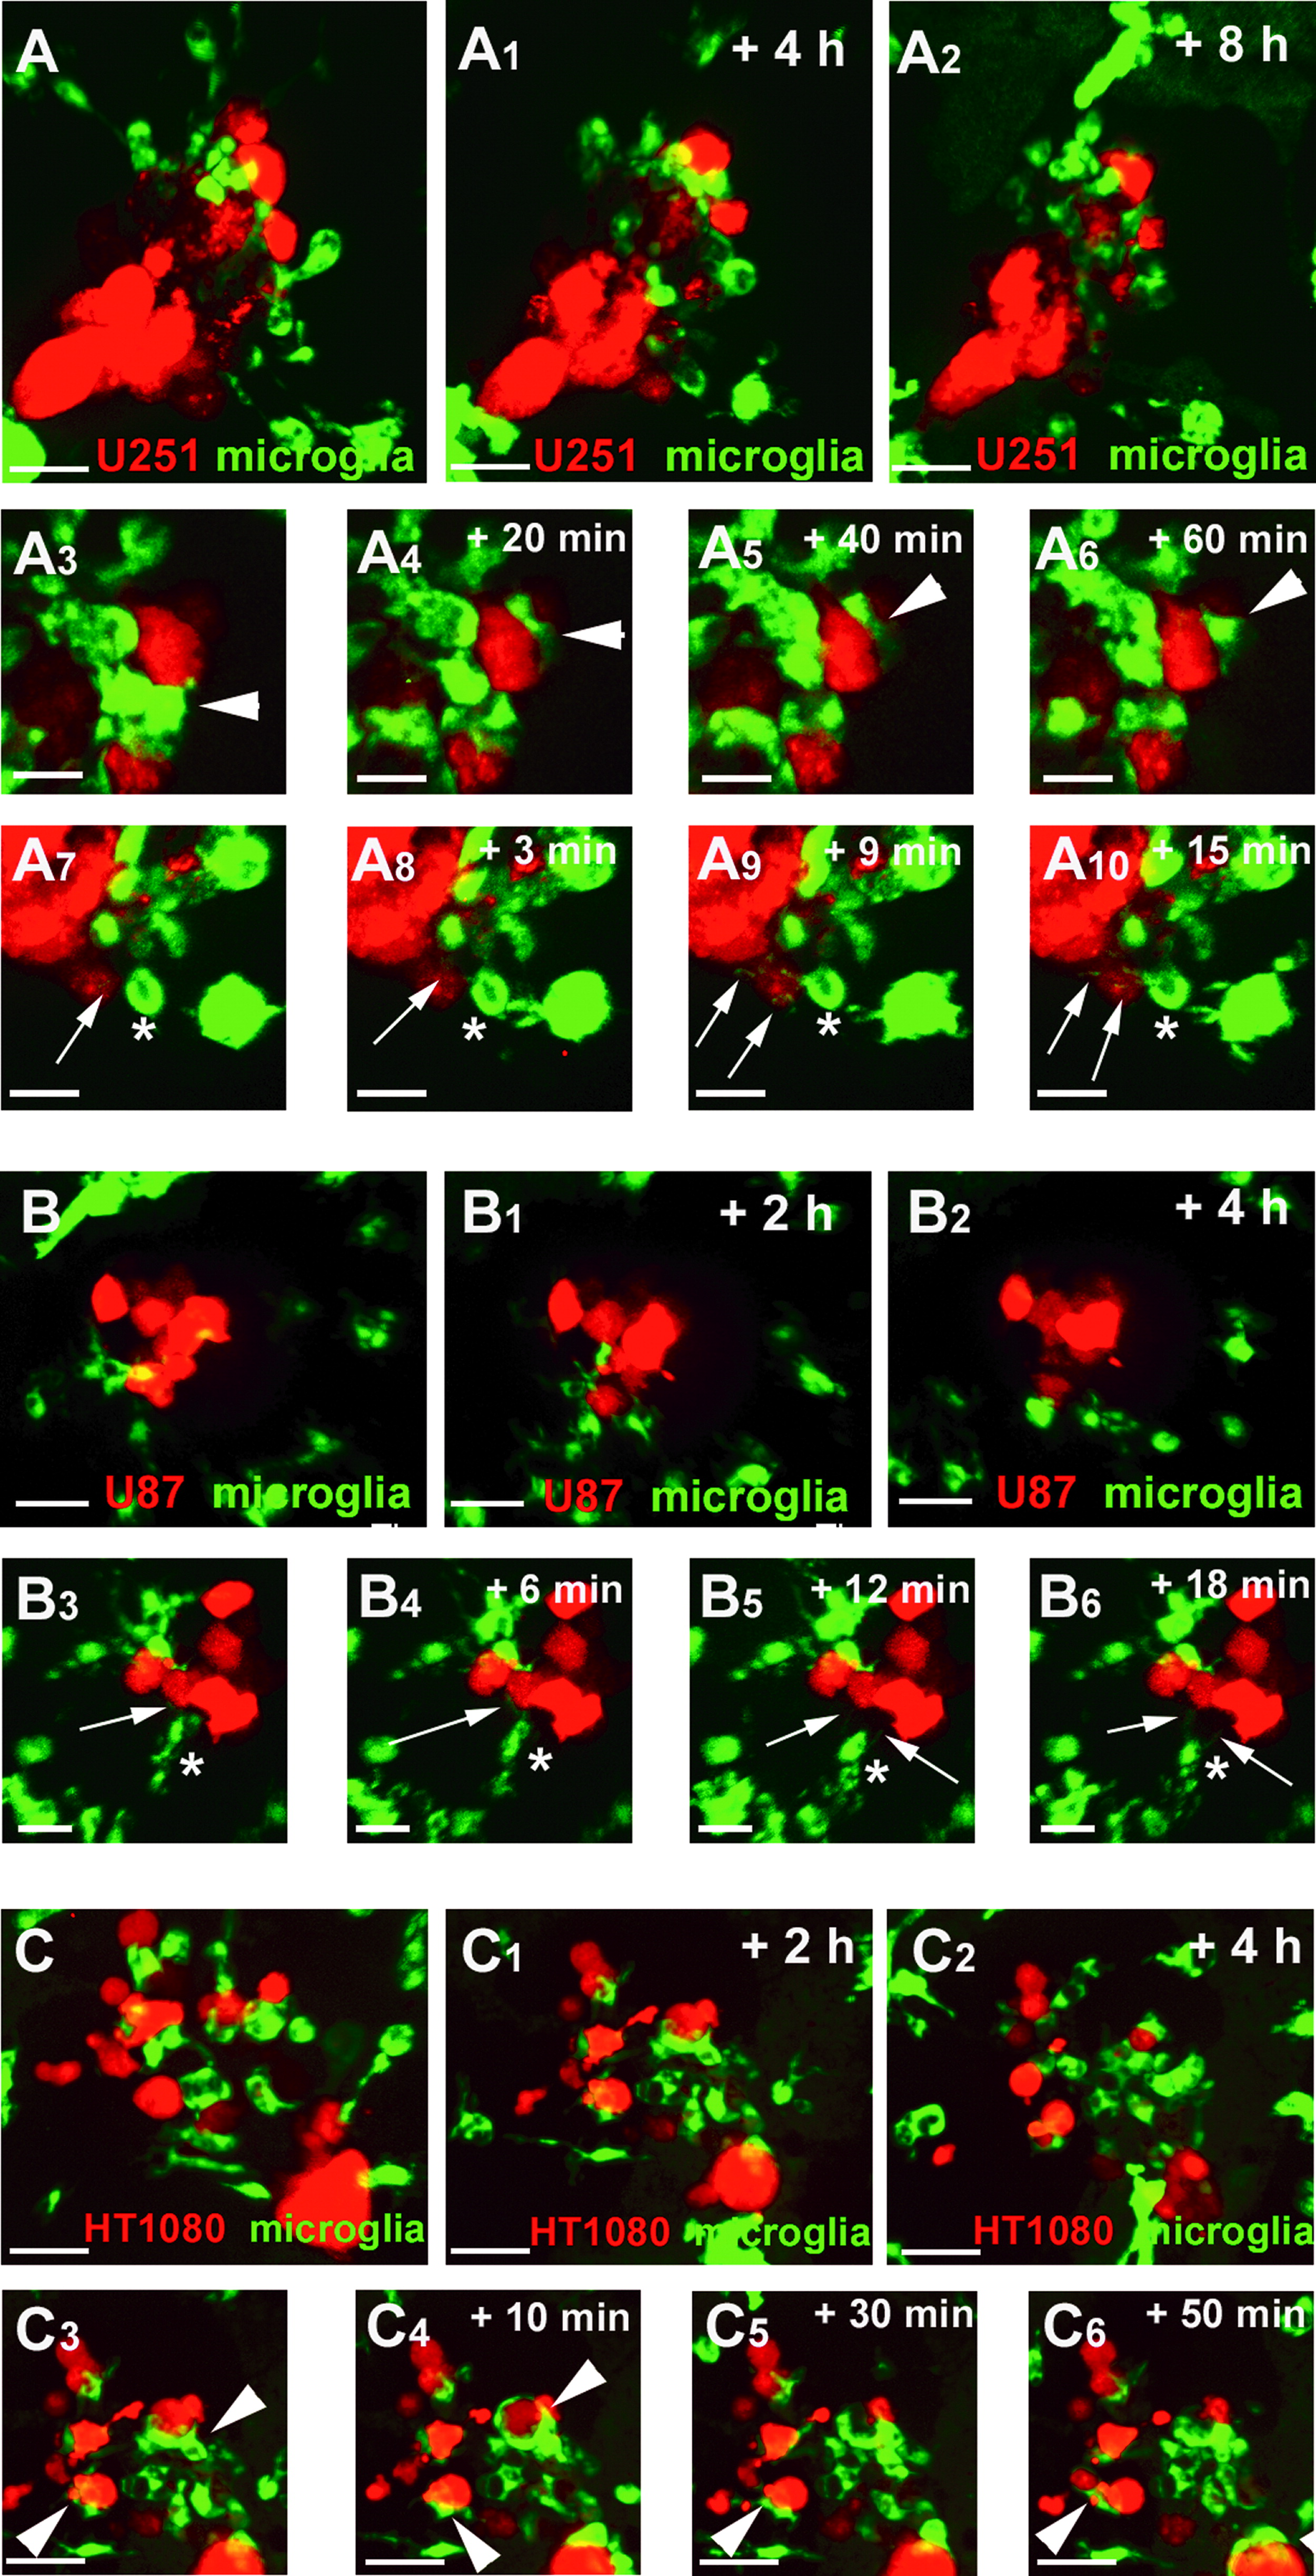
Fig. 3
Microglia interact differently with U251, U87, and HT1080 cells. (A) Confocal time series showing microglia (green) responding to U251 cells (red) in the zebrafish optic tectum (recording times indicated; see also Supplementary Movie S1). (A3?A6) Time series highlighting a microglial cell closely interacting with a U251 cell for more than 60?min. White arrowhead marks the microglial cell interacting with the U251 cell. (A7?A10) Time series highlighting a microglial cell constantly sending and retracting processes toward U251 cells. White asterisk marks a microglial cell sending and retracting processes. White arrows mark microglial processes toward U251 cells. Scale bars for (A?A2): 30??m. Scale bars for (A3?A10): 15??m. (B) Confocal time series showing microglia (green) responding to U87 cells (red) in the zebrafish optic tectum (recording times indicated; see also Supplementary Movie S2). (B3?B6) Time series highlighting a microglial cell closely interacting with U87 cells. White asterisk marks a microglial cell sending and retracting processes. White arrows mark microglial processes toward U87 cells. Scale bars for (B?B2): 30??m. Scale bars for (B3?B6): 20??m. (C) Confocal time series showing microglia (green) responding to HT1080 cells (red) in the zebrafish optic tectum (recording times indicated; see also Supplementary Movie S3). (C3?C6) Time series highlighting microglia engulfing and phagocytosing HT1080 cells. Arrowheads indicate microglia engulfing and phagocytosing HT1080 cells. Scale bars for (C?C6): 30??m. All images represent maximum intensity projections of confocal stacks. Images were captured using an Andor spinning disk confocal microscope with a 20?�?/NA 0.75 objective.