
|
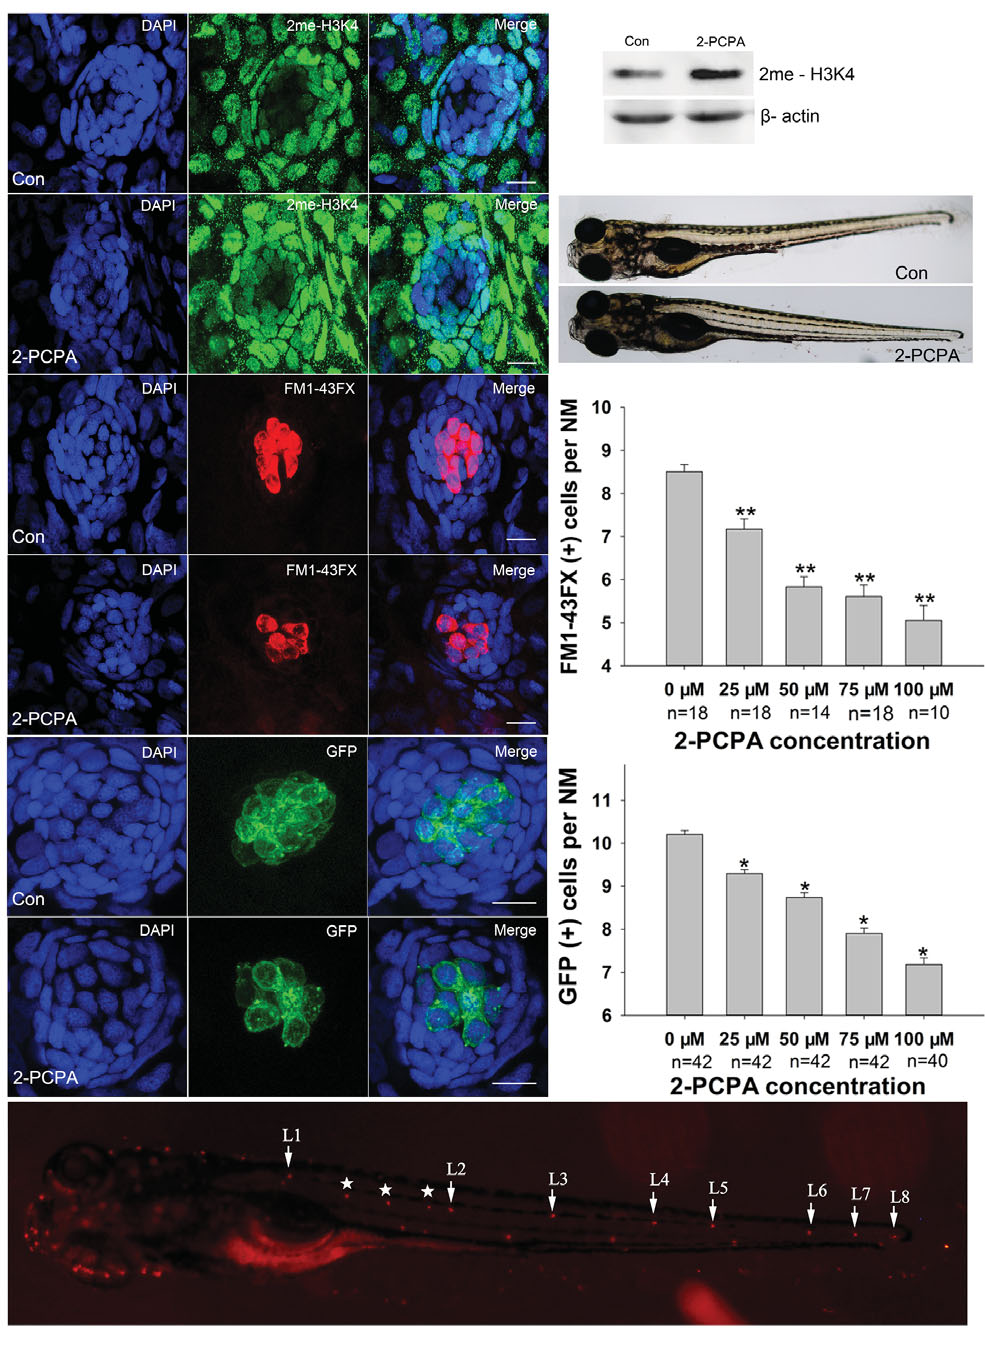
Fig. 1
Neuromast hair cell detection in 5 dpf larvae. (A-C) Effect of 2-PCPA on the levels of histone methylation. Confocal projections of neuromasts of 5 dpf control (A) and 75 µM 2-PCPA treated larvae (B) that have been labeled by dimethyl H3K4 (2me-H3K4). Larvae were stained (green) by immunocytochemistry for dimethyl H3K4. The level of 2me-H3K4 was increased in the presence of 2-PCPA as compared to the controls. (C) Western blot analysis of protein extracted from control and 2-PCPA treated larvae. 2-PCPA treatment induced accumulation of 2me-H3K4 on global histone. β-actin levels were included as a control. (D-E) Neuromast hair cells detection with live staining (FM1-43FX) in 5 dpf larvae. Confocal projections of L1 neuromasts of control (D) and 2-PCPA treated larvae (E) at 5 dpf that have been labeled by FM1-43FX for functional hair cells. Fewer FM1-43FX positive cells were developed in 75 µM 2-PCPA treated larvae than in control. (F-G) Number of neuromast hair cells assessed with GFP visualisation in transgenic line Tg(brn3c:mGFP). GFP expression in neuromasts of control (F) and 2-PCPA treated larvae (G) at 5 dpf. There was a significant decrease in the number of hair cells in larvae received 2-PCPA treatment. Nuclei were stained with DAPI. Scale bars =10 µm. (H) Both the zebrafish larvae treated with 75 µM 2-PCPA from 3 dpf to 5 dpf (lower panel) and control (upper panel) were morphologically normal. (I-J) Quantification of hair cells under 2-PCPA treatment during the early hair cell development period. (I) The average number of functional hair cells per neuromast in 5 dpf zebrafish larvae following 2-PCPA treatment. Graph of functional HCs as seen with FM1-43FX. (J) The average number of differentiated hair cells per neuromast in 5 dpf zebrafish larvae. The number of GFP positive cells were decreased in larvae received 2-PCPA treatment in a dose-dependent manner. The hair cells of the first four neuromast along the body, L1 to L4, were recorded on one side of each fish (n: total number of fish per 2-PCPA dose). Bars are mean ± SEM (one-way ANOVA *P<0.05; **P<0.001). (K) Superimposition of a fluorescent image of a 5 dpf zebrafish larva with neuromasts labelled with FM1-43FX. White arrows point to primary NMs L1 to L8 on the left side of the larva, the image shows secondary NMs (*) and a few NMs from the right side of the larva (not labelled).