
|
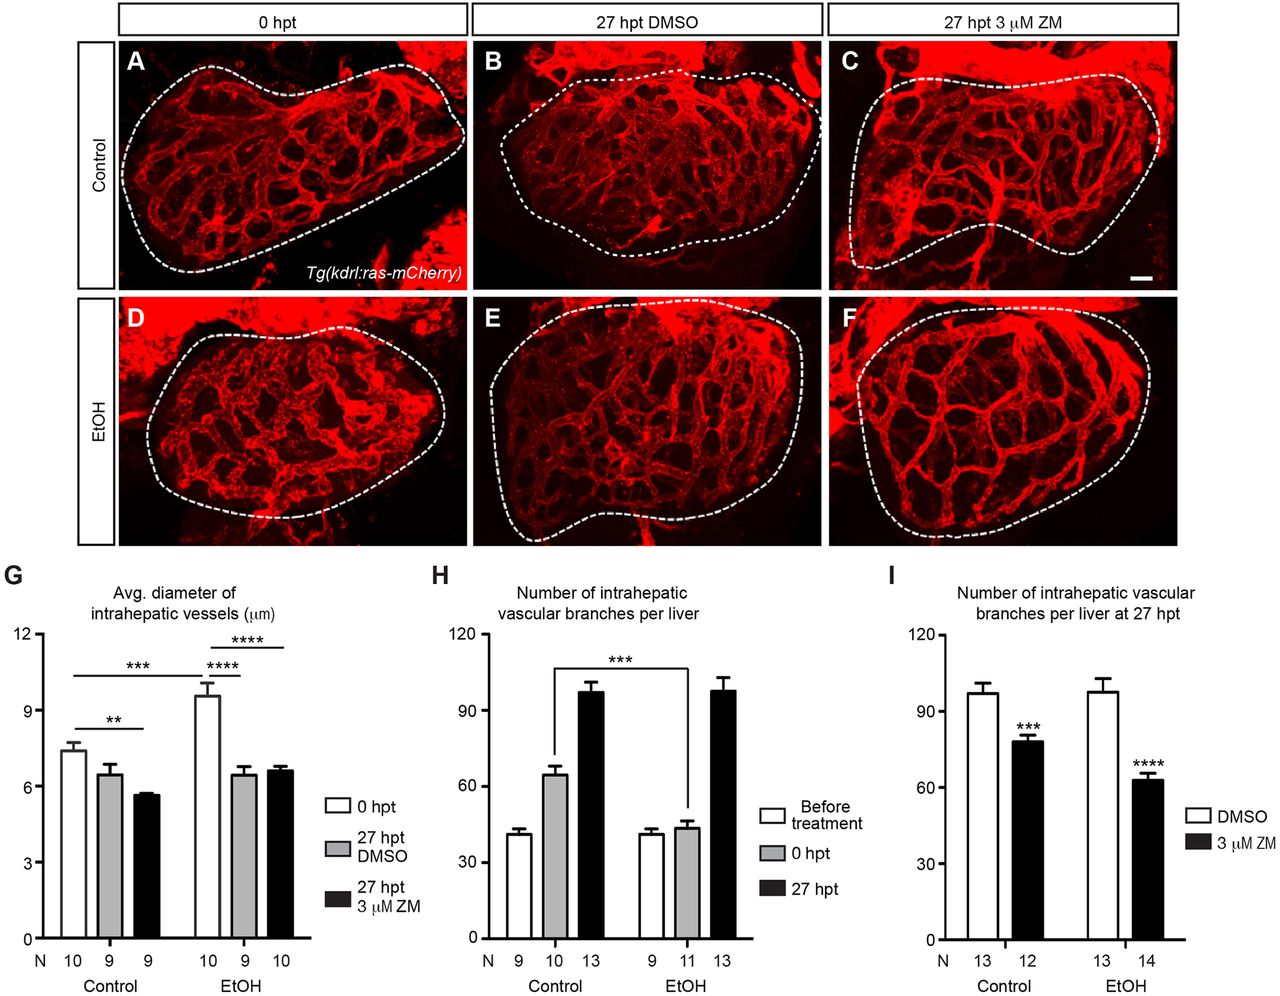
Fig. 3
VEGFR inhibition suppressed hepatic angiogenesis that intensified after acute ethanol treatment. (A-F) Confocal three-dimensional projections of the whole liver in the control and ethanol-injured larvae immediately after ethanol treatment (0 hpt) (A,D), and after 3 h of recovery period plus 24 h of subsequent DMSO or ZM treatment (27 hpt) (B,C,E,F). The intrahepatic vasculature is marked by Tg(kdrl:ras-mCherry) expression. Ventral view, anterior is to the top. Dashed line outlines the liver. Scale bar: 30 μm. (G) Average diameter of intrahepatic vessels (mean±s.e.m.) in control and ethanol-treated livers with or without subsequent ZM treatment. (H) Numbers (mean±s.e.m.) of intrahepatic vascular branches per liver before ethanol treatment, immediately after ethanol treatment (0 hpt) and at 27 h after ethanol treatment (27 hpt). (I) Numbers (mean±s.e.m.) of intrahepatic vascular branches per liver in the larvae treated with DMSO alone, ZM alone, ethanol followed by DMSO, and ethanol followed by ZM, at 27 hpt. (G-I) Each experiment was repeated three times and the numbers of animals analyzed are shown. Statistical significance in G was calculated by one-way ANOVA and Tukey's post-hoc test, and in H,I by two-tailed Student's t-test. **P<0.01; ***P<0.001; ****P<0.0001.