
|
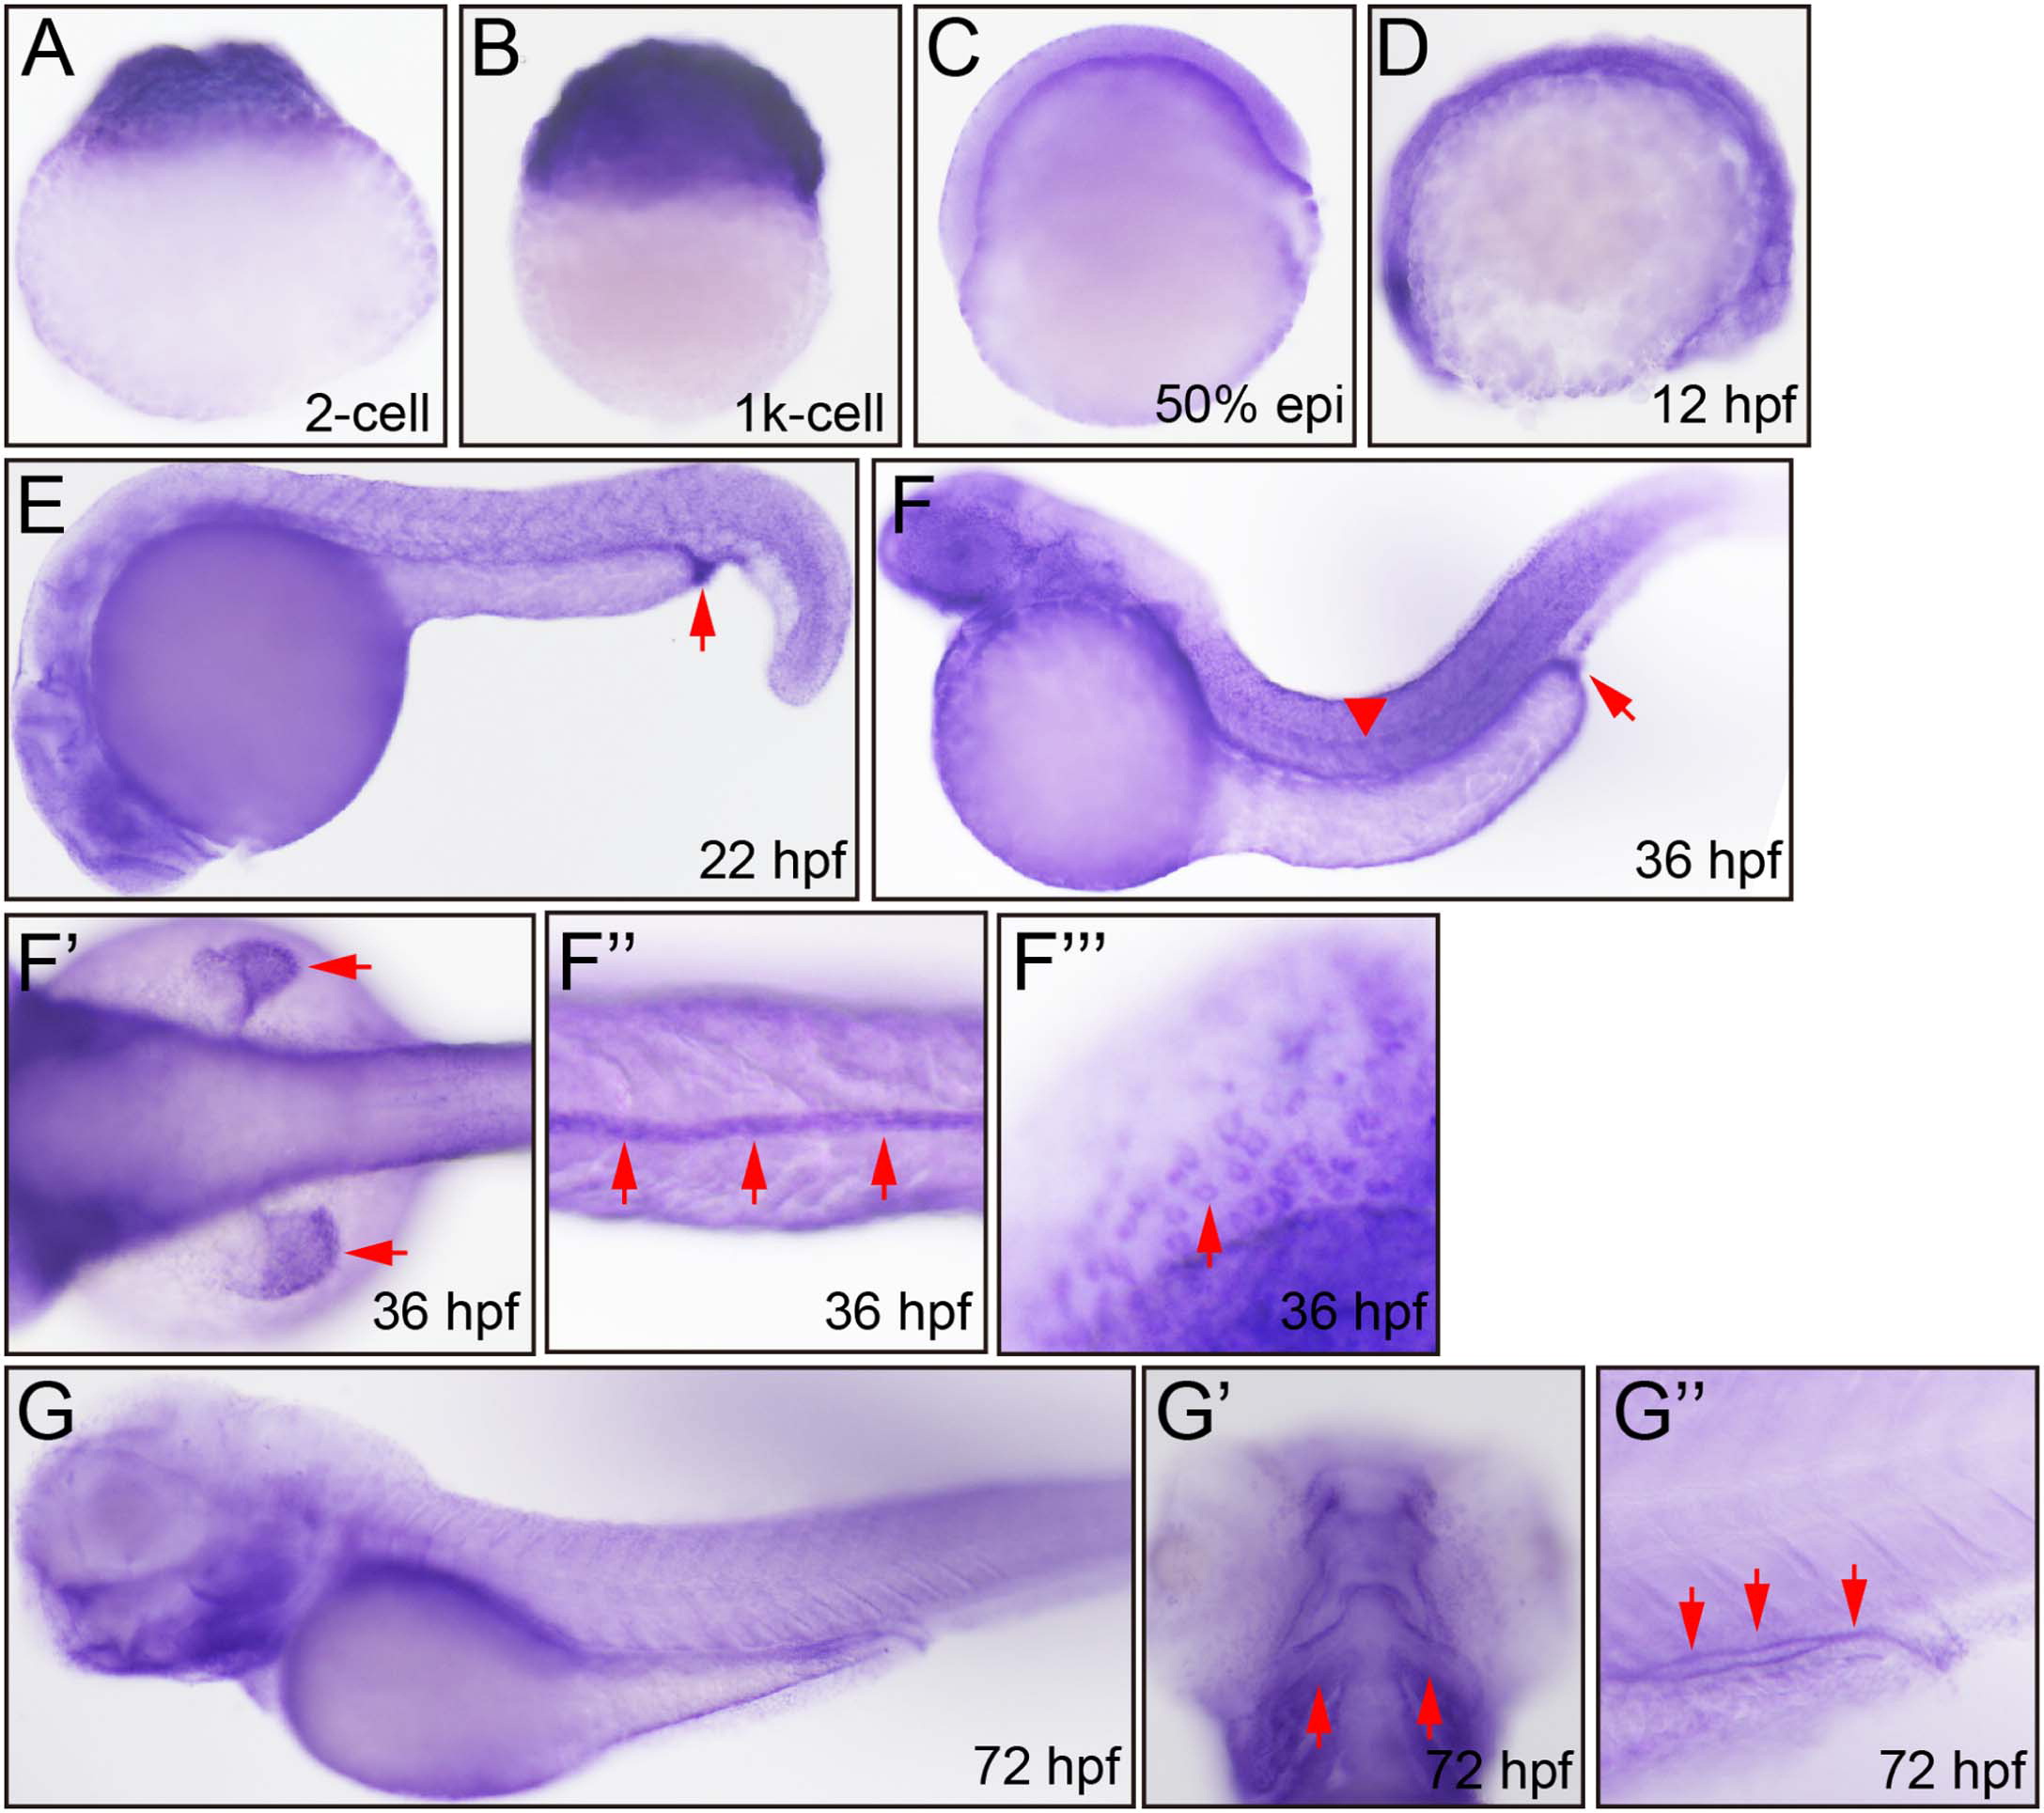
Fig. 3
Whole mount in situ hybridization analysis of zebrafish embryos using antisense itgb1b.1 probe. A. 2-cell, lateral view, strong staining. B. 1K-cell, lateral view. C. 50% epiboly, lateral view. D. 12?hpf, lateral view, epidermis. E. 22?hpf, lateral view, epidermis of the whole body, urogenital opening (arrow). F. 36?hpf, lateral view, epidermis of the whole body, urogenital opening (arrow), notochord (arrowhead). F?. 36?hpf, dorsal view, pectoral fin epidermis (arrow). F?. 36?hpf, ventral view, ventral fin (arrow). F?. 36?hpf, lateral view, head EVL (arrow). G. 72?hpf, lateral view. G?. 72?hpf, ventral view, pharyngeal arch (arrow). G?. 72?hpf, lateral view, intestinal epithelium (arrow).
Reprinted from Gene expression patterns : GEP, 16(2), Wang, X., Li, L., Liu, D., Expression analysis of integrin ?1 isoforms during zebrafish embryonic development, 86-92, Copyright (2014) with permission from Elsevier. Full text @ Gene Expr. Patterns