
|
Fig. 1
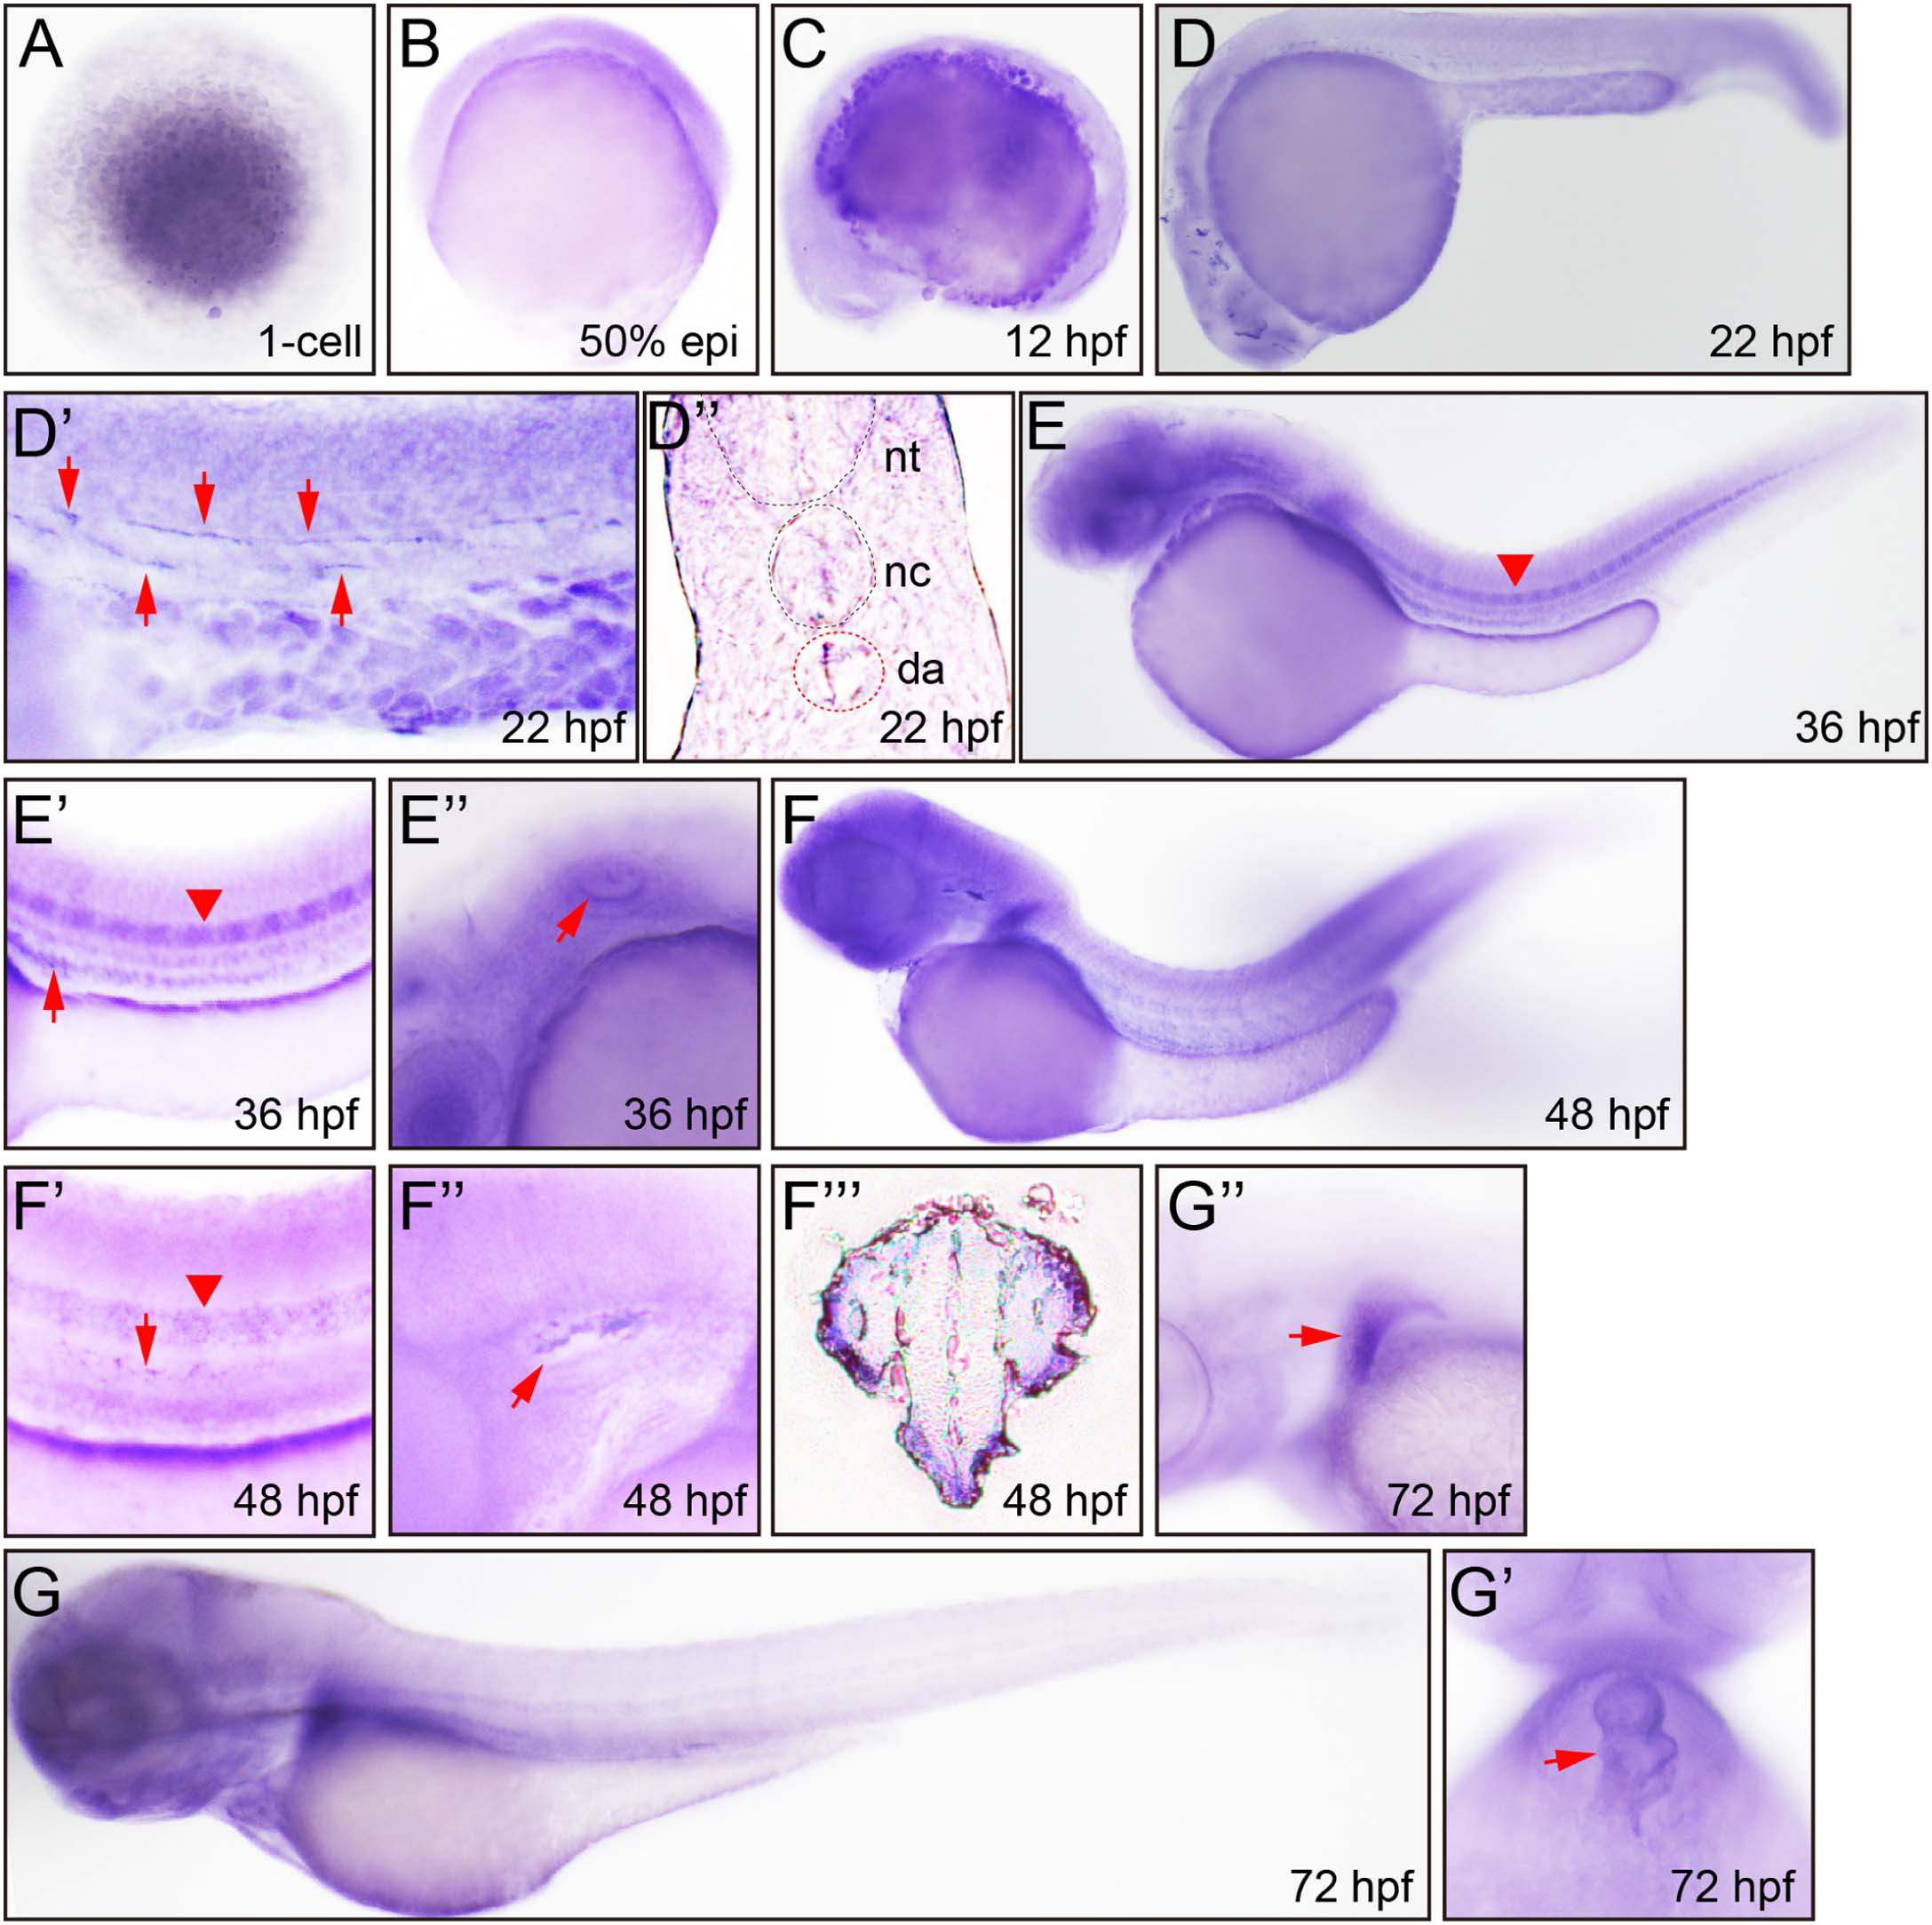
Whole mount in situ hybridization analysis of zebrafish embryos using antisense itgb1a probe. A. 1-cell, dorsal view, weak staining. B. 50% epiboly, lateral view, weak staining. C. 12?hpf, lateral view, epidermis. D. 22?hpf, lateral view, epidermis. D?. 22?hpf, lateral view, dorsal aorta (arrowhead). D?. 22?hpf, transverse section of caudal trunk; nt, neural tube, nc, notochord, da, dorsal aorta. E. 36?hpf, lateral view, overview of whole body, notochord (arrowhead). E?. 36?hpf, lateral view, notochord (arrowhead), dorsal aorta (arrow). E?. 24?hpf, lateral view, otic vesicle. F. 48?hpf, lateral view. F?. 48?hpf, lateral view, notochord (arrowhead), dorsal aorta (arrow). F?. 48?hpf, lateral view, otic vesicle. F?. 48?hpf, transverse section of head, out layer staining. G. 72?hpf, lateral view. G?. 72?hpf, ventral view, heart (arrow). G?. 72?hpf, lateral view, pectoral fin epidermis (arrow).
Reprinted from Gene expression patterns : GEP, 16(2), Wang, X., Li, L., Liu, D., Expression analysis of integrin ?1 isoforms during zebrafish embryonic development, 86-92, Copyright (2014) with permission from Elsevier. Full text @ Gene Expr. Patterns