
|
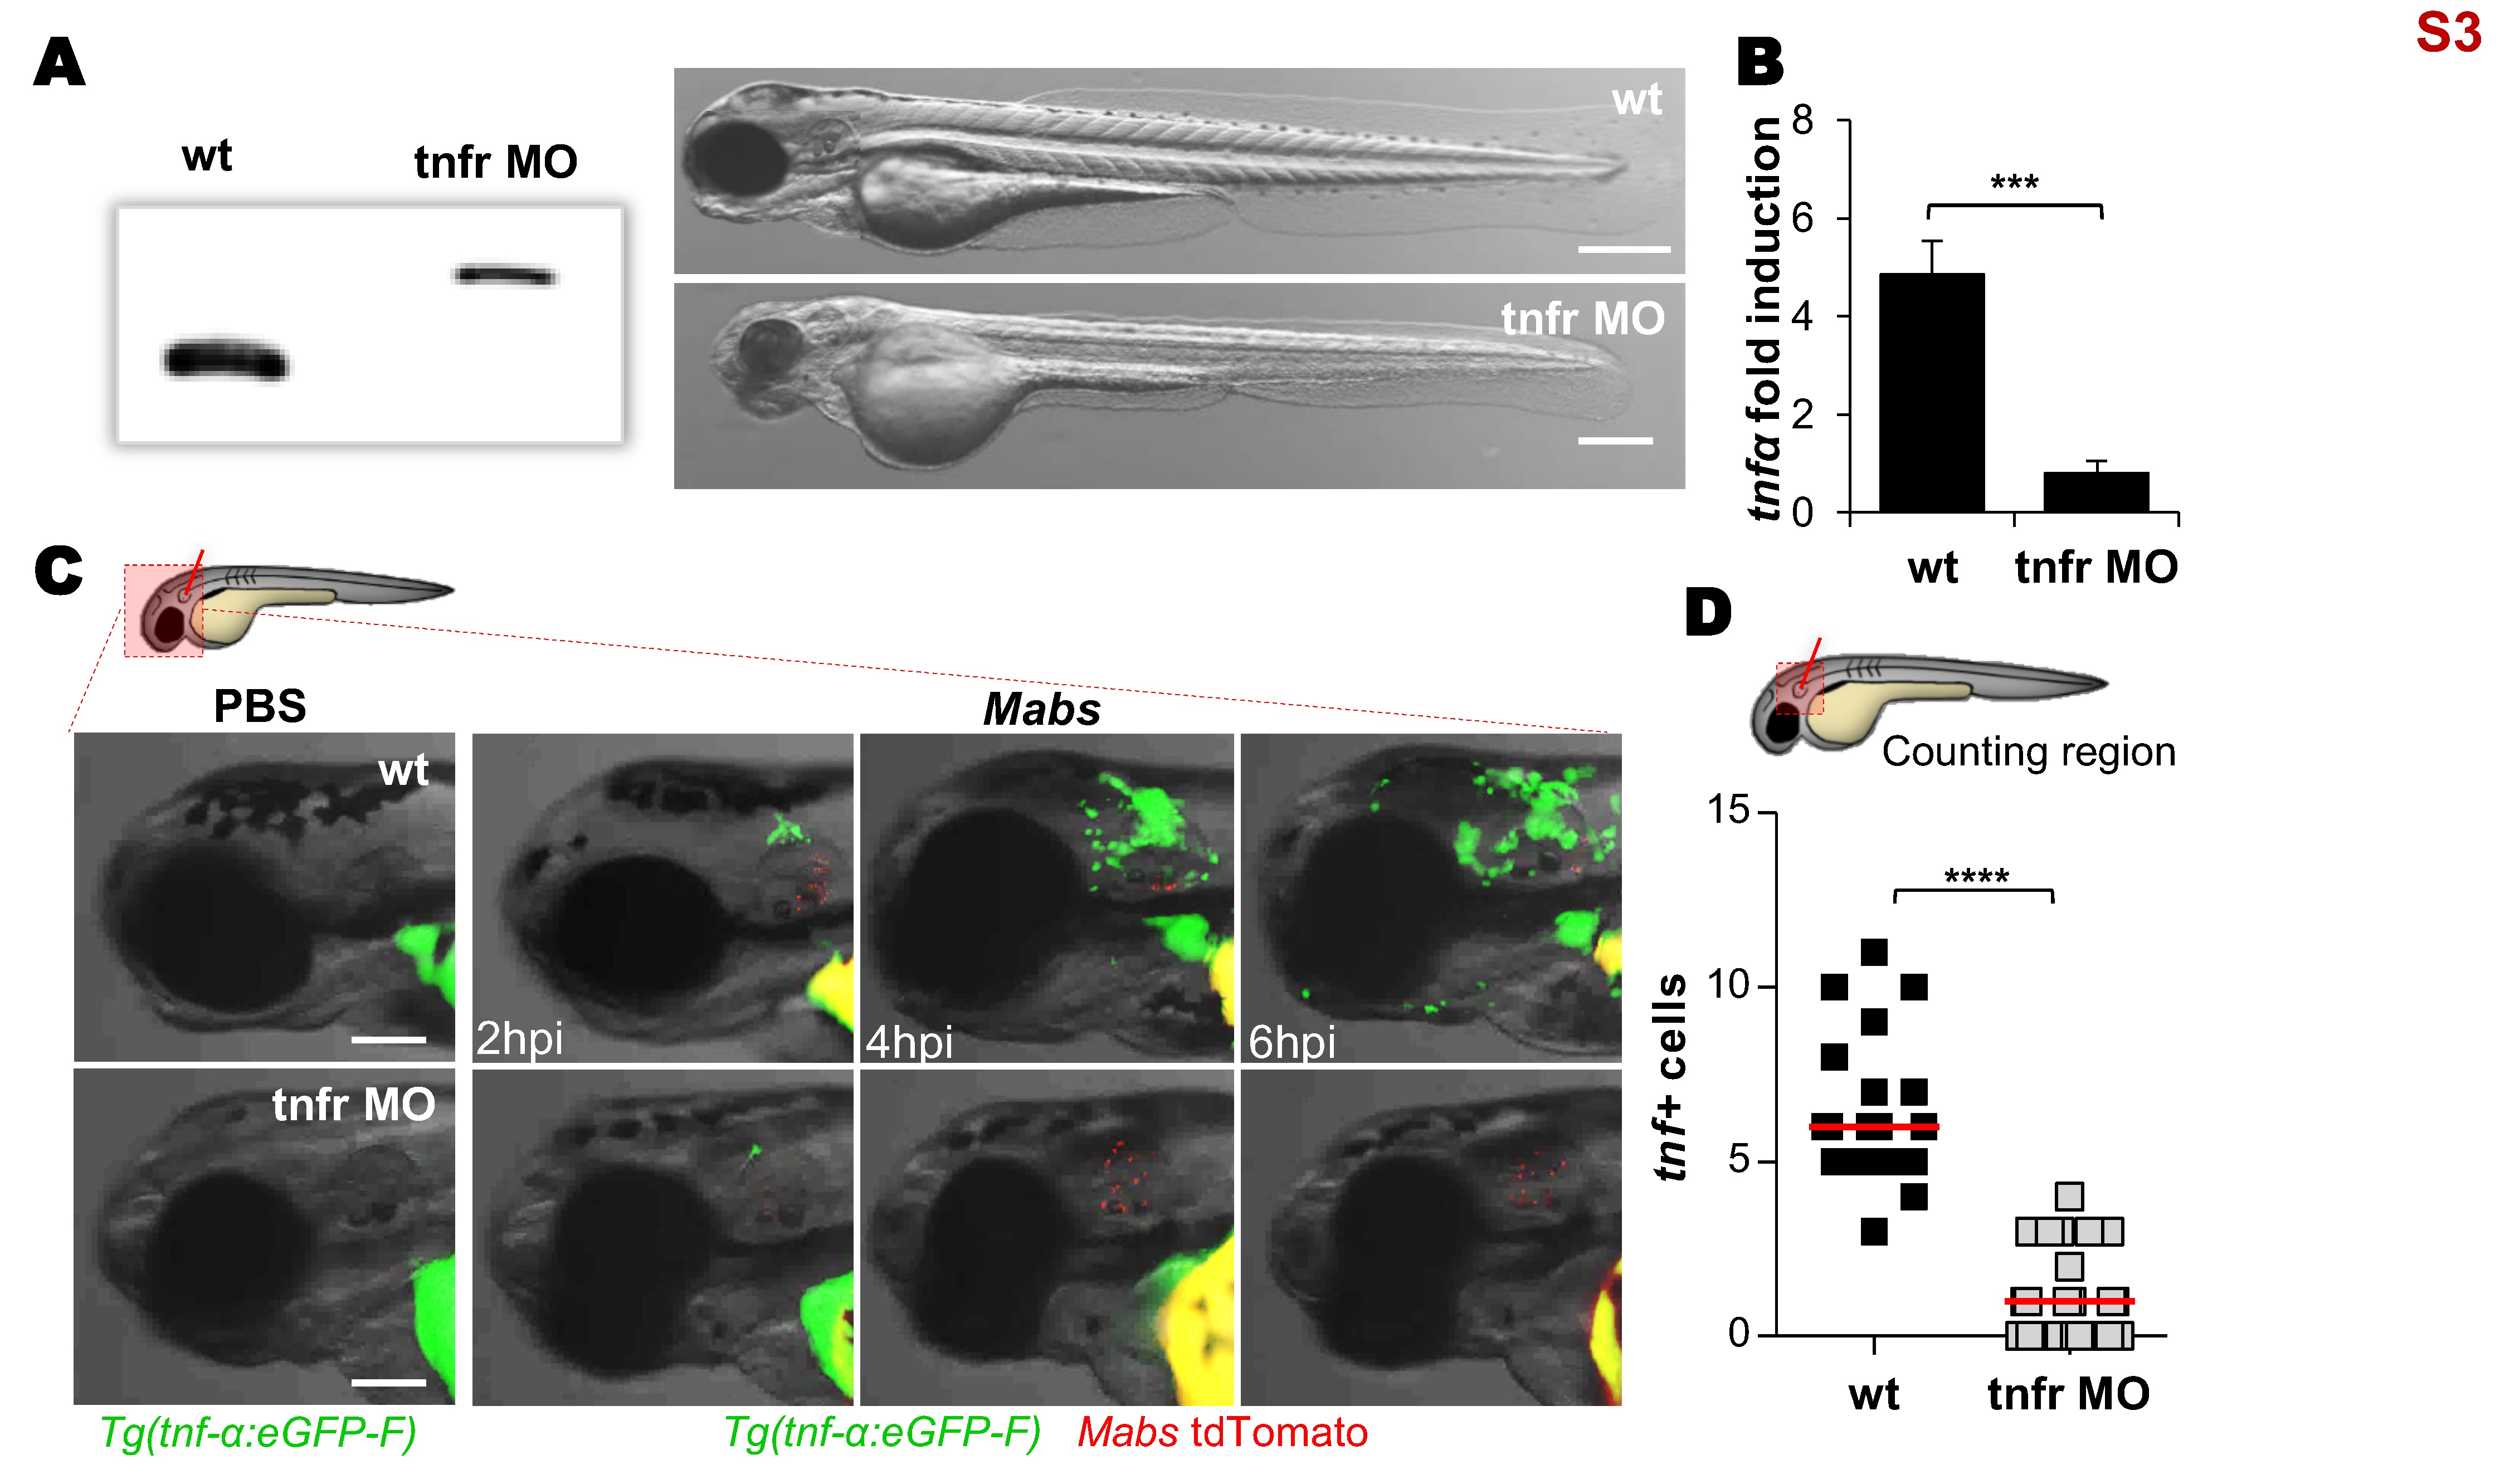
Fig. S3
Tnfr1 morphants generation.
(A-D) Efficiency of morpholino against zebrafish TNFR1. (A) Injection of splice-site blocking antisens morpholinos targeting the TNF receptor 1 (tnfr) leads to a total absence of native tnfr1 transcript. Comparison between WT embryos and tnfr morphants transcripts (2 dpf) reveals the complete absence of native transcript. Bright-field microscopy image comparing the whole morphology appearance of WT embryos versus tnfr morphants at 2 dpf, showing that morpholino knockdown injection produces a moderate hypomorph phenotype: short body length, big yolk sac, smaller swim bladder, small eyes, reduced pigmentation, hindbrain defects, somites poorly organized and epidermic alterations. Scale bars, 200 ?m. (B-D) To check the effect of tnfr1 loss-of-function on the tnf-? production, PBS or tdTomato-Mabs (R variant, ?100 CFU) were injected intravenously (B) or into the otic cavity of either WT or tnfr morphants Tg(tnf-?:eGFP-F) larvae (C-D). (B) qRT-PCR of tnf? (normalized to ef1?) upon Mabs infection. Fold induction compared to entire PBS- injected fishes at 3 dpi. Error bars indicate SEM. (C) Bright-field and fluorescence overlay microscopy showing the real-time visualization of the transcriptional tnf-? expression close to the injection site assessed at 2, 4 and 6 hpi. Scale bars, 100 ?m. (D) Number of tnf-? positive cells per infected larvae evaluated at 2 hpi using confocal microscopy. Each symbol represents individual embryos and horizontal lines indicate the median values. (B and D) Statistical significance was assessed by one-tailed Mann-Whitney?s t test. TNF-? expression subsequent to the infection is impaired in tnfr morphants. Results are presented as average number from two experiments.