
|
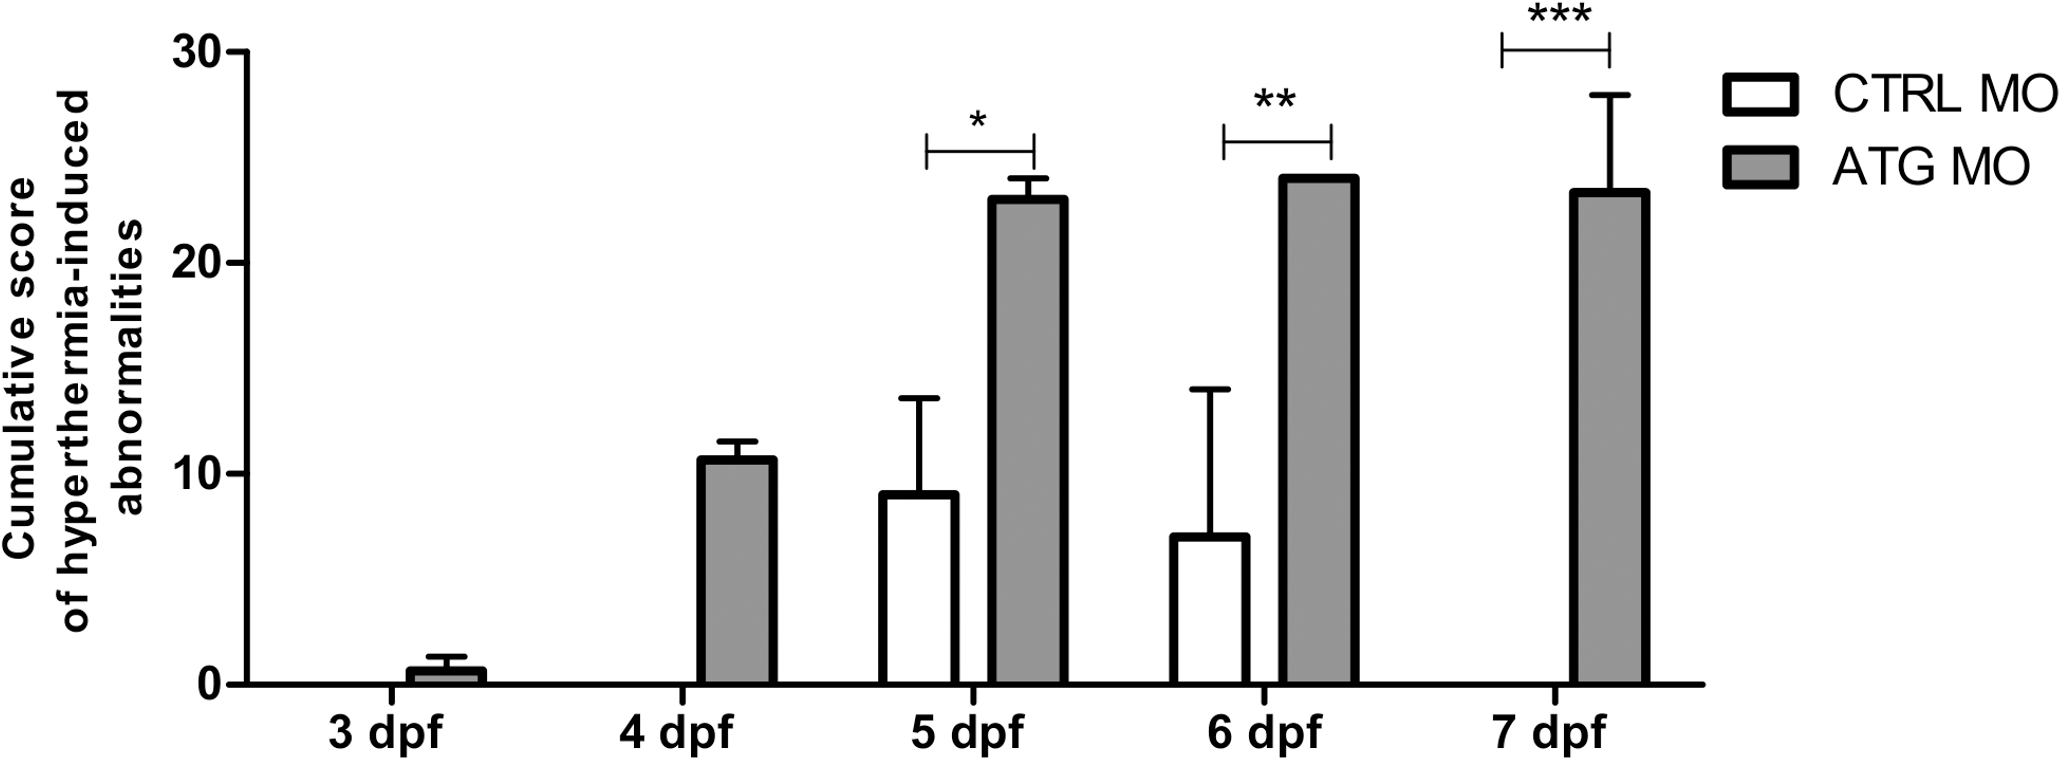
Fig. 5
Confirmation of hyperthermia-induced abnormalities.
The y-axis depicts the cumulative score to quantify the severity of hyperthermia-induced abnormalities 24 hours after heatshock. Normal behavior was scored as 0, decreased touch response and partial loss of posture as 1, absent touch response and complete loss of posture as 2, and death as 3. The number of larvae was multiplied by the value corresponding to the level of severity. The x-axis corresponds to CTRL MO- and ATG MO-injected larvae from 3 dpf to 7 dpf (day of heatshock). Data of graphs are pooled together from three independent experiments with 8 larvae per condition. Statistical analysis was performed using two-way ANOVA with Bonferroni post-tests. Error bars on all graphs represent standard error of mean (SEM). * P ? 0.05, ** P ? 0.01, *** P?0.001.