Fig. 3
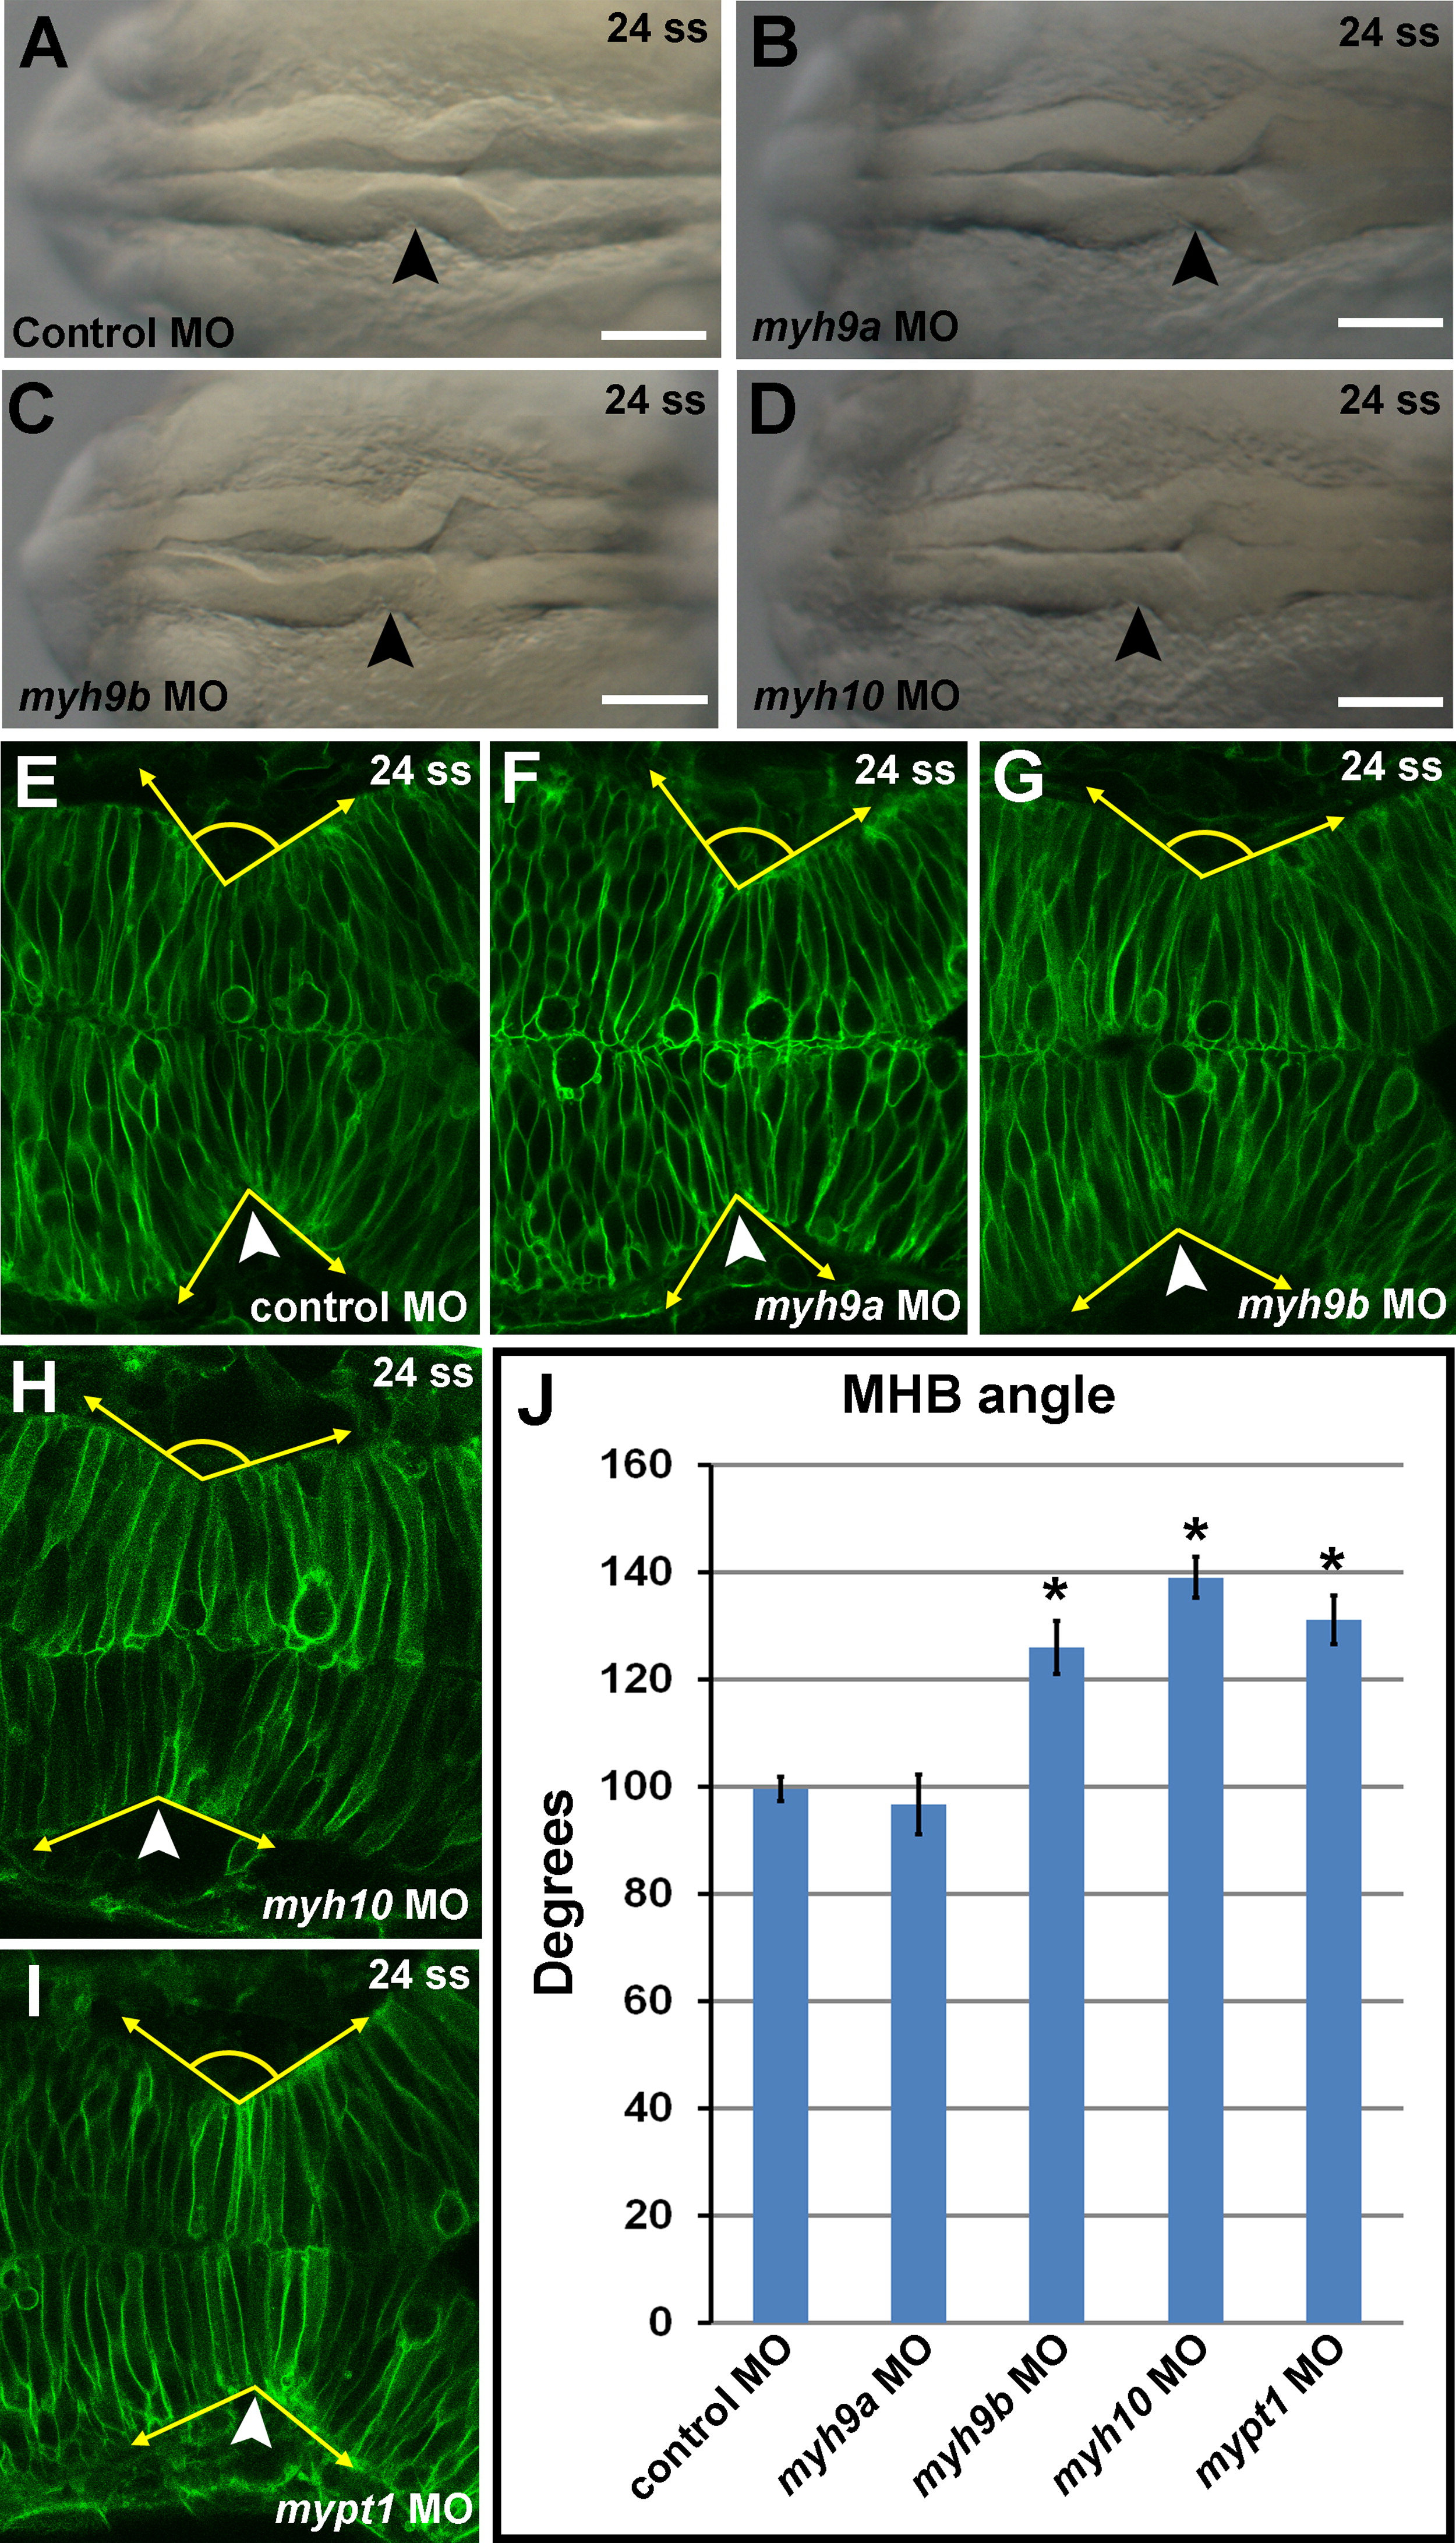
myh9b, myh10, and mypt1 are required for MHB tissue morphogenesis (A-D) Brightfield dorsal view images of 24 ss embryos following injection with (A) control MO, (B) myh9a MO, (C) myh9b MO, (D) myh10 MO. Anterior is to the left in all images. Arrowheads indicate MHBC. Scale bars: 100 µm. (E-I) Live confocal images showing the MHB region of 24 ss zebrafish embryos injected with mGFP mRNA and coinjected with control MO (E), myh9a MO (F), myh9b MO (G), myh10 MO (H), or mypt1 MO (I). (J) Quantification of the MHB angle on the basal side of the neuroepithelium (see angle lines in E-I). One-way ANOVA with multiple t-test comparisons was performed to determine significance between control and test groups. Asterisks indicate p<0.001. Results are shown asħs.e.m. For E-I; control MO, n=48; myh9a MO, n=10; myh9b MO, n=16; myh10 MO, n=18; mypt1 MO, n=20.
Reprinted from Developmental Biology, 397(1), Gutzman, J.H., Sahu, S.U., Kwas, C., Non-muscle myosin IIA and IIB differentially regulate cell shape changes during zebrafish brain morphogenesis, 103-15, Copyright (2015) with permission from Elsevier. Full text @ Dev. Biol.

