
Image
|
Figure Caption
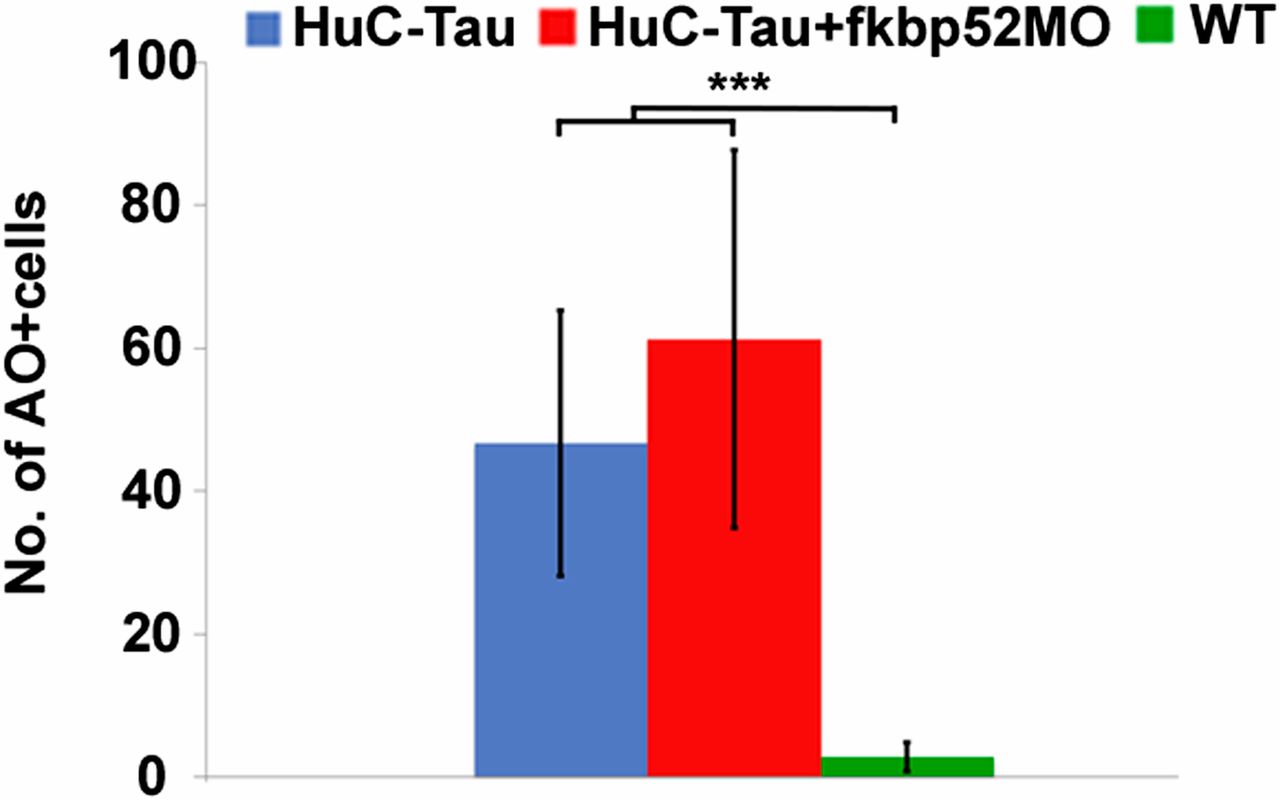
Fig. 6
Bar chart depicts the difference in the number of AO-positive cells. No significant difference was observed between the HuC-Tau and the HuC-Tau injected with FKBP52MO. A difference is observed when comparing these two groups and the WT siblings (***P ≤ 0.0001).
Figure Data
Acknowledgments
This image is the copyrighted work of the attributed author or publisher, and
ZFIN has permission only to display this image to its users.
Additional permissions should be obtained from the applicable author or publisher of the image.
Full text @ Proc. Natl. Acad. Sci. USA