Image
Figure Caption
Fig. 3
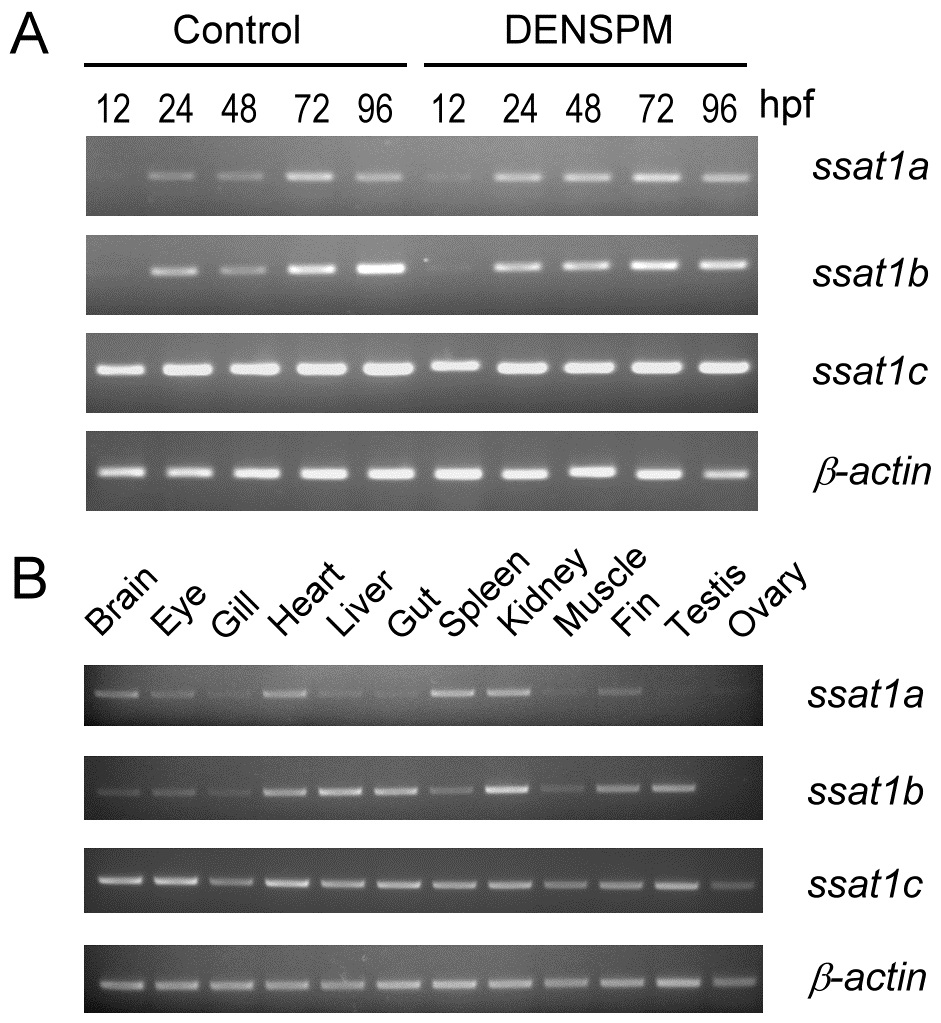
Temporal and spatial expression patterns of zebrafish ssat1 homologous genes.
(A) After fertilization, zebrafish embryos were incubated with or without (control) 10 ÁM DENSPM. Embryos were collected at different developmental stages (shown on the top, hpf, hour post fertilization) and expression of ssat1a, ssat1b, ssat11c, and β-actin were analyzed by RT-PCR. (B) The expression patterns of zebrafish ssat1 homologous genes were also analyzed in the major organs (shown on the top) of adult zebrafish.
Figure Data
Acknowledgments
This image is the copyrighted work of the attributed author or publisher, and
ZFIN has permission only to display this image to its users.
Additional permissions should be obtained from the applicable author or publisher of the image.
Full text @ PLoS One

