Fig. 1
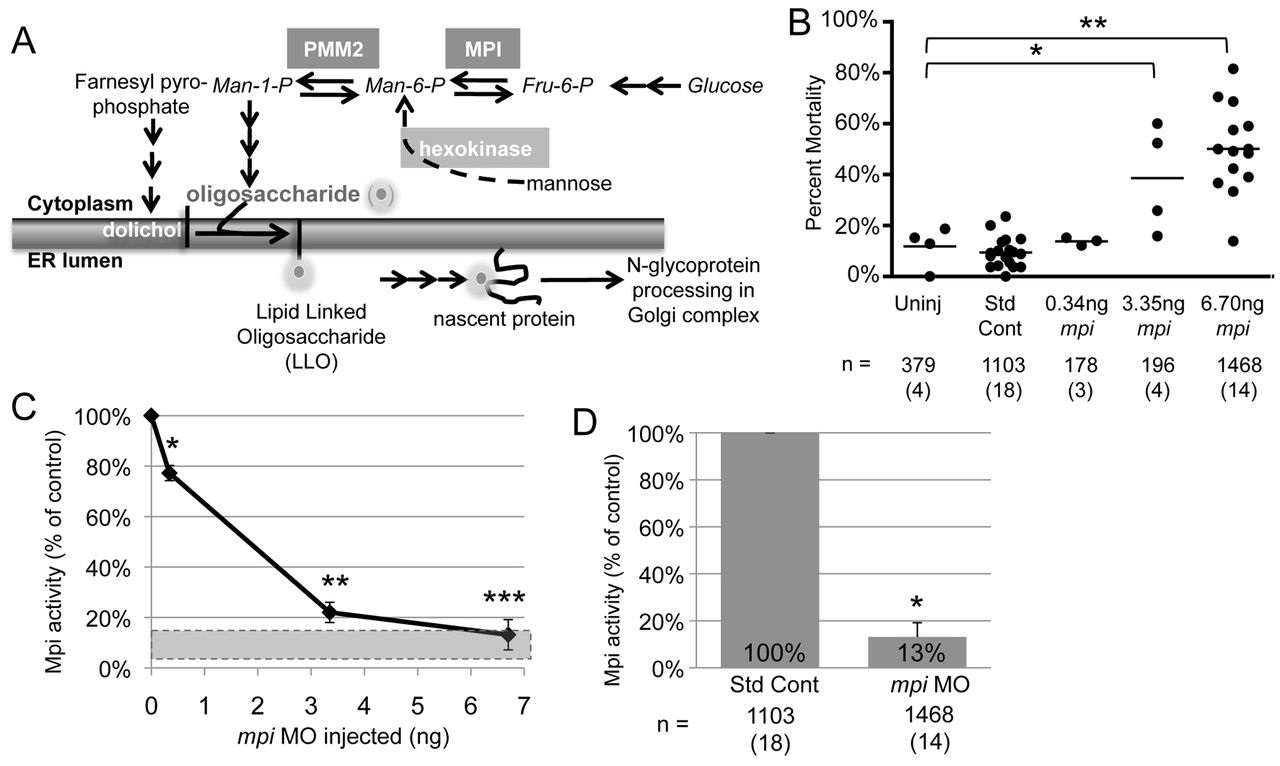
Titration of mpi morpholino results in dose-dependent mortality and Mpi enzyme knockdown. (A) Abridged schematic of N-glycosylation focused on the MPI and PMM2 enzymatic steps. (B) Zebrafish embryos were injected with mpi ATG blocking morpholino (MO) and collected at 4 days post-fertilization (dpf). Cumulative mortality on 4 dpf for the increasing amounts of mpi MO injected are shown. * and **, P<0.0001 by Fisher?s exact test. Numbers in parentheses under n values indicate the number of experiments. (C) Mpi activity was measured in 4 dpf lysates (normalized to total protein) using the standard coupled assay for this enzyme. Mpi activity expressed as the percent of control activity is shown. Gray bar indicates the range of Mpi activity demonstrated in MPI-CDG individuals (3-18%). *P=0.04; **P=7.52E-06; ***P=1.38E-18 by unpaired t-test. (D) Mpi enzyme activity is 13% (as compared with standard control MO) when 6.7 ng of mpi MO is injected. *P<0.0001 by Fisher?s exact test.

