
|
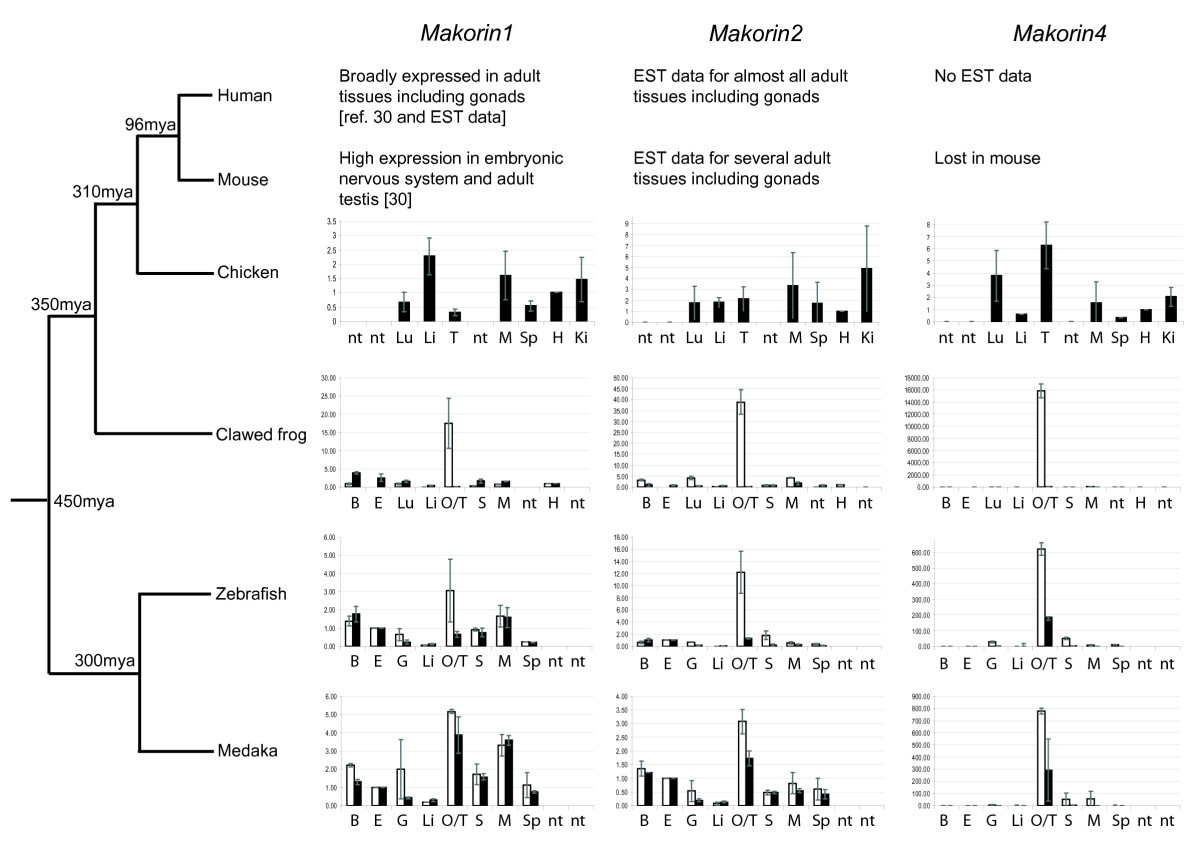
Fig. 5
RT-qPCR expression analysis of makorin genes in vertebrate adult tissues. Q-PCR values for each gene were normalized to expression levels of rpl7 using the 2-DDCT method [71]. Expression in eye (fish) or heart (chicken and frog) was set as a reference (value: 1); Data are presented as mean ± standard deviation of two independent quantitative real-time PCR experiments (average of two independent reverse transcription reactions, each tested with two PCR reactions). Black bars represent male tissues and organs, white bars female tissues and organs. B brain, E eye, G gills, H heart, I intestine, K kidneys, Lu lung, Li liver, M muscle, O ovary, S skin, Sp spleen, T testis, nt not tested.