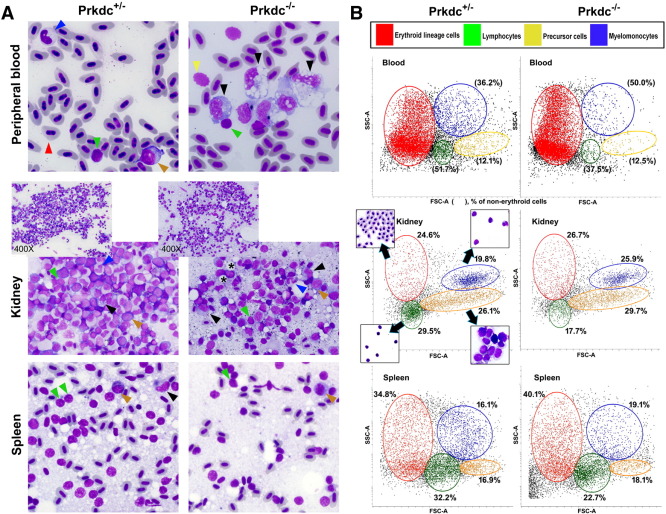
Fig. 4
Hematologic findings of the major blood cell lineages. (A) Wright-Giemsa staining with the smeared cells from the peripheral blood, kidney, and spleen. All images are 1000× view except insets (400×) in middle column. Arrowheads are colored as green for lymphocytes, red for erythroid lineage cells, blue for neutrophils, yellow for thrombocytes, black for monocytes/macrophages, and brown for blasts/precursor cells. Microscopic observation of these organs revealed much decreased number of the lymphocytes in the SCID zebrafish compared with the one in the heterozygote control (detailed counting results are shown in Table 1). The lymphocytes appeared as small cells with a higher nuclear to cytoplasmic ratio, and the monocytes/macrophages appeared as larger cells with a lower nuclear to cytoplasmic ratio and cytoplasmic vacuoles. Direct smear of dissected kidney and spleen also revealed lower lymphocyte fractions in SCID zebrafish. Note the compact cells in the smear of kidney marrow from control and frequent fat globules (*) in the smear from SCID zebrafish. (B) Flow cytometry. Forward scatter (FSC) and side scatter (SSC) are proportional to cell size and cellular granularity, respectively. Peripheral blood and single cell suspensions from the dissected kidney and spleen were processed for flow cytometry. The flow cytometry demonstrated four main cell populations (noted in the box). Note that lymphocyte fractions are markedly decreased in the SCID zebrafish compared with those of the heterozygote control.

